Estimated Value: $249,000 - $261,000
2
Beds
2
Baths
1,332
Sq Ft
$191/Sq Ft
Est. Value
About This Home
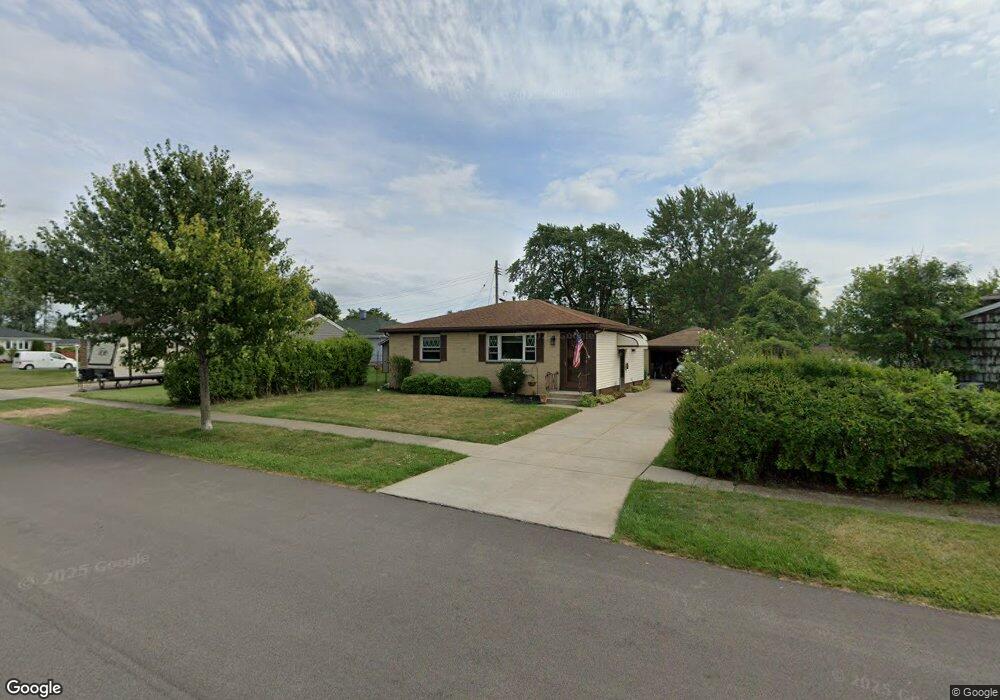
This home is located at 99 Morris Cir, Depew, NY 14043 and is currently estimated at $254,004, approximately $190 per square foot. 99 Morris Cir is a home located in Erie County with nearby schools including Cayuga Heights Elementary School, Depew Middle School, and Depew High School.
Ownership History
Date
Name
Owned For
Owner Type
Purchase Details
Closed on
Nov 18, 2021
Sold by
Swyers John C and Swyers Nancy A
Bought by
Wegner Stacy A and Tucker Clinton M
Current Estimated Value
Home Financials for this Owner
Home Financials are based on the most recent Mortgage that was taken out on this home.
Original Mortgage
$186,558
Outstanding Balance
$171,185
Interest Rate
3.09%
Mortgage Type
FHA
Estimated Equity
$82,820
Purchase Details
Closed on
Jun 19, 2019
Sold by
Bowen Walter W and Bowen Esther A
Bought by
Swyers Nancy A and Swyers John C
Create a Home Valuation Report for This Property
The Home Valuation Report is an in-depth analysis detailing your home's value as well as a comparison with similar homes in the area
Home Values in the Area
Average Home Value in this Area
Purchase History
| Date | Buyer | Sale Price | Title Company |
|---|---|---|---|
| Wegner Stacy A | $190,000 | Mortgage Title Guaranty | |
| Swyers Nancy A | -- | None Available |
Source: Public Records
Mortgage History
| Date | Status | Borrower | Loan Amount |
|---|---|---|---|
| Open | Wegner Stacy A | $186,558 |
Source: Public Records
Tax History
| Year | Tax Paid | Tax Assessment Tax Assessment Total Assessment is a certain percentage of the fair market value that is determined by local assessors to be the total taxable value of land and additions on the property. | Land | Improvement |
|---|---|---|---|---|
| 2024 | $6,452 | $165,000 | $15,000 | $150,000 |
| 2023 | $5,997 | $165,000 | $15,000 | $150,000 |
| 2022 | $5,991 | $165,000 | $15,000 | $150,000 |
| 2021 | $4,483 | $154,000 | $15,000 | $139,000 |
| 2020 | $3,787 | $104,500 | $11,600 | $92,900 |
| 2019 | $1,614 | $104,500 | $11,600 | $92,900 |
| 2018 | $3,876 | $104,500 | $11,600 | $92,900 |
| 2017 | $1,606 | $104,500 | $11,600 | $92,900 |
| 2016 | $3,811 | $104,500 | $11,600 | $92,900 |
| 2015 | -- | $104,500 | $11,600 | $92,900 |
| 2014 | -- | $100,500 | $11,600 | $88,900 |
Source: Public Records
Map
Nearby Homes
Your Personal Tour Guide
Ask me questions while you tour the home.