NOT LISTED FOR SALE

99 N Francis St Excelsior Springs, MO 64024

Estimated Value: $101,000 - $146,000

2 Beds
1 Bath
736 Sq Ft
$169/Sq Ft Est. Value

Last Sold February 09, 2022

Current estimated payment $736/month

About This Home

As of February 2022

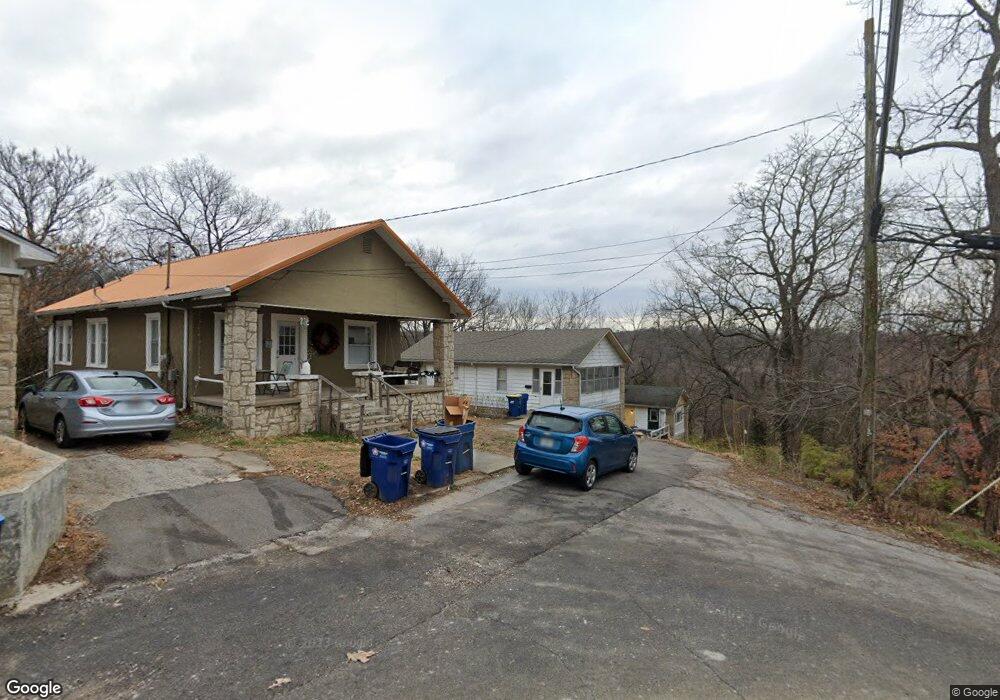
Come check out this cute little bungalow! Home is in need of some TLC but has had a brand new roof put on 2020, plumbing has been updated 2021, and electrical has been updated 2021. You can enjoy your morning coffee on the enclosed front porch. With a little bit of fixing up and elbow grease this home could be brought back to life.

Ownership History

Date Name Owned For Owner Type

Purchase Details

Closed on
Aug 1, 2025
Sold by
Schrock-Ringenberg Llc
Bought by
Schrock Jacob W
Current Estimated Value
$124,139

Home Financials for this Owner

Home Financials are based on the most recent Mortgage that was taken out on this home.
Original Mortgage
$107,070
Outstanding Balance
$106,978
Interest Rate
6.77%
Mortgage Type
New Conventional
Estimated Equity
$17,161

Purchase Details

Listed on
May 12, 2021
Closed on
Feb 10, 2022
Sold by
11T Mo Llc
Bought by
Schrock-Ringenburg Llc
Seller's Agent
Jamie Talley
RE/MAX Innovations
Buyer's Agent
Melissa Bartlett
Jason Mitchell Real Estate Mis
List Price
$80,000

Home Financials for this Owner

Home Financials are based on the most recent Mortgage that was taken out on this home.
Avg. Annual Appreciation
31.24%

Purchase Details

Closed on
Apr 29, 2020
Sold by
Guardian Tax Mo Llc
Bought by
11T Mo Llc

Purchase Details

Closed on
Oct 11, 2019
Sold by
Tinsley Elby F and Tinsley Ethel M
Bought by
Guardian Tax Mo Llc
Source: Public Records

Range of Values:

Collateral Analytics

Collateral Analytics Collateral Analytics AVMs (Automated Valuation Model) employ a number of statistical approaches combined with neighborhood-specific comparable selection guarantees the most up-to-date and precise valuations.

Not Available

Collateral Analytics does not have data for the current month. Please view the chart for historical values.

ICE

ICE Mortgage Technology ICE Mortgage Technology’s AVM (Automated Valuation Model) is a state-of-the-art online residential property valuation tool that provides a quick and accurate estimate of the value of almost any home in the U.S.

Not Available

ICE Mortgage Technology does not have data for the current month. Please view the chart for historical values.

First American

First American First American Data & Analytics’ next-generation AVM combines unrivaled data assets with a blended ensemble of valuation models to produce highly accurate, reliable valuations you can trust.

Not Available

First American does not have data for the current month. Please view the chart for historical values.

Quantarium

Quantarium Quantarium’s valuation service, repeatedly proven the industry’s most accurate and comprehensive, is supercharged with a self-learning and auto-tuning AI engine that continually becomes smarter and more accurate as it processes daily inputs from the industry’s leading RE data lake.

Not Available

Quantarium does not have data for the current month. Please view the chart for historical values.

Average Value
Not Available
List Price
Sold Price
Create a Home Valuation Report for This Property
The Home Valuation Report is an in-depth analysis detailing your home's value as well as a comparison with similar homes in the area

Home Values in the Area

Source: Public Records

Average Home Value in this Area


Source: Public Records

Purchase History

Date Buyer Sale Price Title Company
Schrock Jacob W $106,000 Meridian Title
Schrock-Ringenburg Llc $45,900 New Title Company Name
11T Mo Llc -- None Available
Guardian Tax Mo Llc -- None Available
Source: Public Records

Mortgage History

Date Status Borrower Loan Amount
Open Schrock Jacob W $107,070
Closed Schrock Jacob W $107,070
Source: Public Records

Property History

Date Event Price List to Sale Price per Sq Ft Prior Sale
02/09/2022 02/09/22 Sold -- -- -- View Prior Sale
01/05/2022 01/05/22 Price Changed $49,500 -9.2% $67 / Sq Ft
11/17/2021 11/17/21 Price Changed $54,500 -8.4% $74 / Sq Ft
10/21/2021 10/21/21 Price Changed $59,500 -7.8% $81 / Sq Ft
09/16/2021 09/16/21 Price Changed $64,500 -7.2% $88 / Sq Ft
08/20/2021 08/20/21 Price Changed $69,500 -7.3% $94 / Sq Ft
07/21/2021 07/21/21 Price Changed $75,000 -3.2% $102 / Sq Ft
06/16/2021 06/16/21 Price Changed $77,500 -3.1% $105 / Sq Ft
05/12/2021 05/12/21 For Sale $80,000 -- $109 / Sq Ft

Tax History Compared to Growth

Source: Public Records

Tax History

Year Tax Paid Tax Assessment Tax Assessment Total Assessment is a certain percentage of the fair market value that is determined by local assessors to be the total taxable value of land and additions on the property. Land Improvement
2025 $915 $20,250 -- --
2024 $915 $13,050 -- --
2023 $910 $13,050 $0 $0
2022 $881 $12,430 $0 $0
2021 $884 $12,426 $1,330 $11,096
2020 $842 $11,510 $0 $0
2019 $842 $11,514 $1,330 $10,184
2018 $706 $9,630 $0 $0
2017 $700 $9,630 $1,330 $8,300
2016 $689 $9,630 $1,330 $8,300
2015 $695 $9,630 $1,330 $8,300
2014 $586 $8,040 $1,330 $6,710
Source: Public Records

Agents Affiliated with this Home

  • Section Image
  • Section Image
See All Agents

Map