99 Niemira Ave Unit 2-B Indialantic, FL 32903
Paradise Beach NeighborhoodEstimated Value: $434,000 - $494,538
3
Beds
3
Baths
1,810
Sq Ft
$256/Sq Ft
Est. Value
About This Home
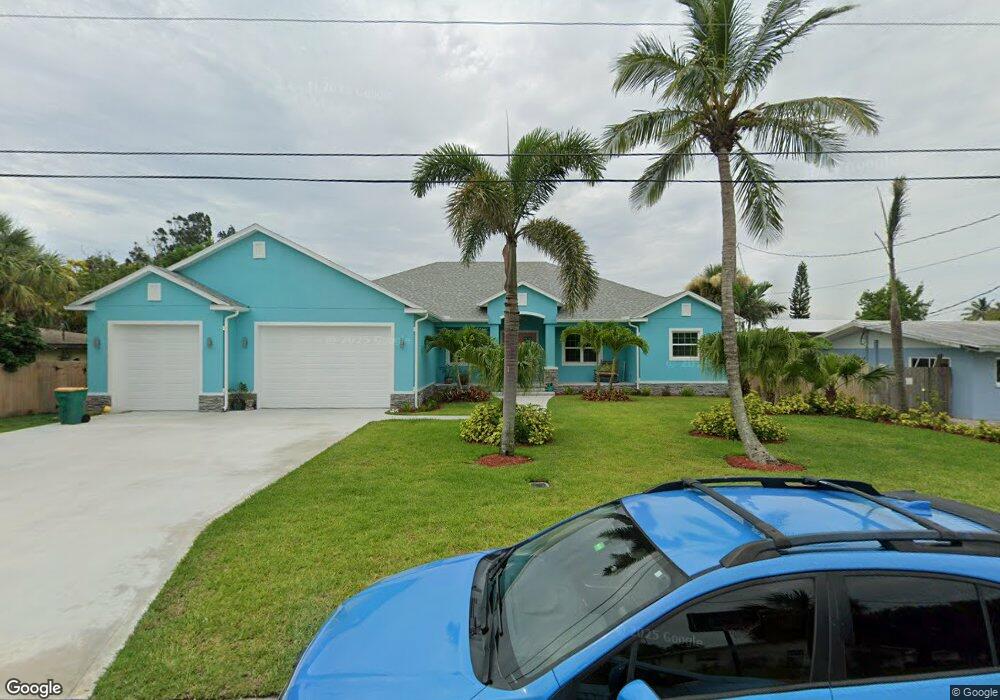
This home is located at 99 Niemira Ave Unit 2-B, Indialantic, FL 32903 and is currently estimated at $463,385, approximately $256 per square foot. 99 Niemira Ave Unit 2-B is a home located in Brevard County with nearby schools including Indialantic Elementary School, Herbert C. Hoover Middle School, and Melbourne Senior High School.
Ownership History
Date
Name
Owned For
Owner Type
Purchase Details
Closed on
Apr 9, 2021
Sold by
Nelson Andrew H and Nelson Jennifer S
Bought by
Nelson Andrew Hartley and Nelson Jennifer Solms
Current Estimated Value
Purchase Details
Closed on
Jul 22, 2019
Sold by
Grimson Ricky M and Benchimol Mirian
Bought by
Nelson Jennifer S and Nelson Andrew H
Home Financials for this Owner
Home Financials are based on the most recent Mortgage that was taken out on this home.
Original Mortgage
$224,000
Outstanding Balance
$196,244
Interest Rate
3.82%
Mortgage Type
New Conventional
Estimated Equity
$267,141
Purchase Details
Closed on
Jun 15, 2018
Sold by
Spinazzola Michael A and Spinazzola Mary M
Bought by
Grimson Ricky M and Benchimol Mirian
Purchase Details
Closed on
Mar 26, 2001
Sold by
Roddenberry Andrew B and Myers Deborah J
Bought by
Spinazzola Michael A and Spinnazzola Mary M
Home Financials for this Owner
Home Financials are based on the most recent Mortgage that was taken out on this home.
Original Mortgage
$70,000
Interest Rate
7.02%
Create a Home Valuation Report for This Property
The Home Valuation Report is an in-depth analysis detailing your home's value as well as a comparison with similar homes in the area
Home Values in the Area
Average Home Value in this Area
Purchase History
| Date | Buyer | Sale Price | Title Company |
|---|---|---|---|
| Nelson Andrew Hartley | -- | Attorney | |
| Nelson Jennifer S | $280,000 | Landing Title Agency Inc | |
| Grimson Ricky M | $228,500 | Alliance Title Insurance Age | |
| Spinazzola Michael A | $130,000 | -- |
Source: Public Records
Mortgage History
| Date | Status | Borrower | Loan Amount |
|---|---|---|---|
| Open | Nelson Jennifer S | $224,000 | |
| Previous Owner | Spinazzola Michael A | $70,000 |
Source: Public Records
Tax History Compared to Growth
Tax History
| Year | Tax Paid | Tax Assessment Tax Assessment Total Assessment is a certain percentage of the fair market value that is determined by local assessors to be the total taxable value of land and additions on the property. | Land | Improvement |
|---|---|---|---|---|
| 2025 | $4,909 | $388,360 | -- | -- |
| 2024 | $4,652 | $385,550 | -- | -- |
| 2023 | $4,652 | $361,740 | $120,000 | $241,740 |
| 2022 | $4,408 | $320,820 | $0 | $0 |
| 2021 | $3,689 | $238,470 | $70,000 | $168,470 |
| 2020 | $3,516 | $224,880 | $60,000 | $164,880 |
| 2019 | $2,743 | $204,730 | $60,000 | $144,730 |
| 2018 | $3,138 | $189,490 | $53,000 | $136,490 |
| 2017 | $3,059 | $179,980 | $53,000 | $126,980 |
| 2016 | $2,901 | $158,970 | $40,000 | $118,970 |
| 2015 | $2,862 | $149,850 | $40,000 | $109,850 |
| 2014 | $2,742 | $138,780 | $40,000 | $98,780 |
Source: Public Records
Map
Nearby Homes
- 107 Franklyn Ave
- 995 N Highway A1a Unit 510
- 995 N Highway A1a Unit 203
- 995 N Highway A1a
- 995 N Highway A1a Unit 103
- 989 N Highway A1a Unit 5
- 137 Washington Ave Unit B
- 925 N Highway A1a Unit 501
- 1145 N Shannon Ave Unit 29
- 1125 N Highway A1a Unit 501
- 877 N Highway A1a Unit 905
- 877 N Highway A1a Unit 308
- 877 N Highway A1a Unit 1208
- 877 N Highway A1a Unit 104
- 877 N Hwy A1a Hwy Unit 401
- 877 N Hwy A1a Hwy Unit 208
- 225 Chalet Ave
- 1177 N Highway A1a Unit 202
- 1570 N Highway A1a
- 1760 N Highway A1a
- 105 Niemira Ave Unit 2-E
- 101 Niemira Ave Unit 2-C
- 103 Niemira Ave Unit 2D
- 97 Niemira Ave Unit A
- 97 Niemira Ave Unit G
- 97 Niemira Ave Unit F
- 97 Niemira Ave Unit B
- 97 Niemira Ave Unit C
- 97 Niemira Ave
- 97 Niemira Ave Unit E
- 97 Niemira Ave Unit 2-F
- 97 Niemira Ave Unit 2A
- 97 Niemira Ave Unit D
- 97 Niemira Ave
- 107 Niemira Ave Unit 2-F
- 109 Niemira Ave Unit G
- 109 Niemira Ave Unit 2-G
- 97 -G Niemira
- 106 Franklyn Ave
- 106 Franklyn Ave Unit 106