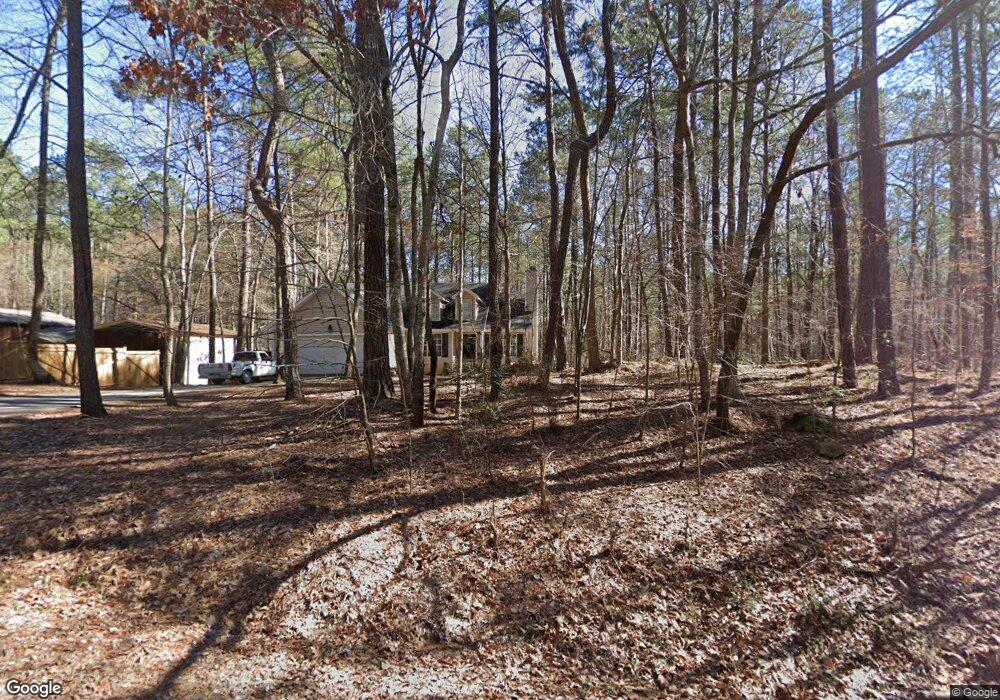
99 Oriole Cir Monticello, GA 31064
Jasper County NeighborhoodEstimated Value: $252,713 - $277,000
3
Beds
2
Baths
1,243
Sq Ft
$216/Sq Ft
Est. Value
About This Home
This home is located at 99 Oriole Cir, Monticello, GA 31064 and is currently estimated at $268,178, approximately $215 per square foot. 99 Oriole Cir is a home located in Jasper County with nearby schools including Jasper County Primary School, Washington Park Elementary School, and Jasper County Middle School.
Ownership History
Date
Name
Owned For
Owner Type
Purchase Details
Closed on
Sep 16, 2010
Sold by
Federal Home Loan Mortgage Corporation
Bought by
Bruno Properties Management Ll
Current Estimated Value
Purchase Details
Closed on
May 4, 2010
Sold by
Wells Fargo Bank Na
Bought by
Federal Home Loan Mortgage Corporation
Purchase Details
Closed on
Aug 20, 2007
Sold by
Hicks Jeanette
Bought by
Poole Deborah M
Home Financials for this Owner
Home Financials are based on the most recent Mortgage that was taken out on this home.
Original Mortgage
$97,000
Interest Rate
6.7%
Mortgage Type
New Conventional
Purchase Details
Closed on
Feb 5, 2007
Sold by
Hicks Jeanette
Bought by
Hicks Jeanette
Purchase Details
Closed on
Sep 25, 2001
Sold by
Smith Barbara S
Bought by
Matthews C T
Purchase Details
Closed on
May 8, 1995
Bought by
Smith Barbara S
Purchase Details
Closed on
Feb 7, 1995
Bought by
Zekowski Robert J
Create a Home Valuation Report for This Property
The Home Valuation Report is an in-depth analysis detailing your home's value as well as a comparison with similar homes in the area
Home Values in the Area
Average Home Value in this Area
Purchase History
| Date | Buyer | Sale Price | Title Company |
|---|---|---|---|
| Bruno Properties Management Ll | $25,000 | -- | |
| Federal Home Loan Mortgage Corporation | -- | -- | |
| Poole Deborah M | -- | -- | |
| Hicks Jeanette | -- | -- | |
| Matthews C T | $4,000 | -- | |
| Smith Barbara S | $5,500 | -- | |
| Zekowski Robert J | $30,000 | -- |
Source: Public Records
Mortgage History
| Date | Status | Borrower | Loan Amount |
|---|---|---|---|
| Previous Owner | Poole Deborah M | $97,000 |
Source: Public Records
Tax History Compared to Growth
Tax History
| Year | Tax Paid | Tax Assessment Tax Assessment Total Assessment is a certain percentage of the fair market value that is determined by local assessors to be the total taxable value of land and additions on the property. | Land | Improvement |
|---|---|---|---|---|
| 2024 | $2,492 | $90,108 | $3,600 | $86,508 |
| 2023 | $2,267 | $81,268 | $2,600 | $78,668 |
| 2022 | $2,130 | $70,188 | $2,600 | $67,588 |
| 2021 | $1,980 | $58,188 | $760 | $57,428 |
| 2020 | $1,936 | $54,388 | $760 | $53,628 |
| 2019 | $1,735 | $46,268 | $600 | $45,668 |
| 2018 | $1,614 | $42,108 | $600 | $41,508 |
| 2017 | $1,521 | $38,628 | $600 | $38,028 |
| 2016 | $1,398 | $34,628 | $800 | $33,828 |
| 2015 | $1,278 | $29,628 | $400 | $29,228 |
| 2014 | $1,027 | $22,908 | $400 | $22,508 |
Source: Public Records
Map
Nearby Homes
- 128 Turtle Cove
- 118 Turtle Cove Throughway
- 128 Turtle Cove Trailway
- 111 Turtle Cove Throughway
- 0 Waxwing Dr Unit 10518396
- 76 Killdeer Ln
- 281 Mockingbird Dr
- 94 Bunting Ct
- 114 Heron Ct
- 170 Loon Trail
- 350 Hummingbird Dr
- 235 Waxwing Dr
- 238 W Mourning Dove
- 56 Starling Dr
- 389 Waxwing Dr
- 458 Falcon Cir
- 15 Egret Ct
- 0 Robin Ct Unit 10527408
- 1019 Whippoorwill Rd
- 124 Flamingo Dr
- 123 Oriole Cir
- 91 Oriole Cir
- 141 Oriole Cir
- 112 Turtle Cove Throughway
- 171 Oriole Cir
- 193 Oriole Cir
- 207 Oriole Cir
- 90 Turtle Cove Throughway
- 0 Turtle Cove Trail Way Unit Lot 71 8806414
- 0 Turtle Cove Trail Way Unit Lot 23 8740967
- 0 Turtle Cove Trail Way Unit Lot 50 8726194
- 0 Turtle Cove Trail Way Unit Lot 23 8670303
- 281 Oriole Cir Unit 3
- 129 Turtle Cove Throughway
- 129 Turtle Cove
- 111 Turtle Cove Trailway
- LOT 74 Turtle Cove Trailway
- 129 Turtle Cove Trailway
- 0 Oriole Cir Unit 8388818
- 0 Oriole Cir Unit 8341858