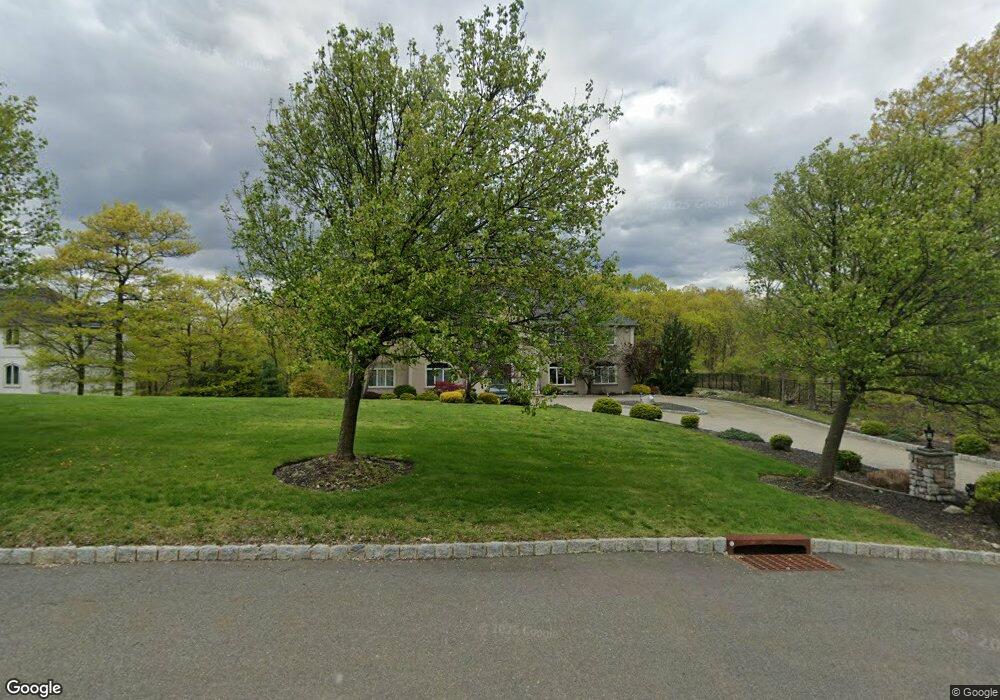
99 Overlook Rd Pomona, NY 10970
Estimated Value: $1,702,521 - $2,526,000
6
Beds
7
Baths
6,096
Sq Ft
$357/Sq Ft
Est. Value
About This Home
This home is located at 99 Overlook Rd, Pomona, NY 10970 and is currently estimated at $2,178,507, approximately $357 per square foot. 99 Overlook Rd is a home located in Rockland County with nearby schools including Grandview Elementary School, Pomona Middle School, and Ramapo High School.
Ownership History
Date
Name
Owned For
Owner Type
Purchase Details
Closed on
Aug 25, 2016
Sold by
Aspinall David R and Aspinall Andrea M
Bought by
Gellman Daniel and Gellman Simcha
Current Estimated Value
Purchase Details
Closed on
Jan 20, 2006
Sold by
R & C Builders Llc
Bought by
Aspinall David R and Aspinall Andrea M
Home Financials for this Owner
Home Financials are based on the most recent Mortgage that was taken out on this home.
Original Mortgage
$1,000,000
Interest Rate
5.37%
Mortgage Type
Fannie Mae Freddie Mac
Purchase Details
Closed on
Nov 5, 2004
Sold by
Torsoe Brothers Construction Corp
Bought by
R & C Builders Llc
Home Financials for this Owner
Home Financials are based on the most recent Mortgage that was taken out on this home.
Original Mortgage
$325,000
Interest Rate
8%
Mortgage Type
Seller Take Back
Create a Home Valuation Report for This Property
The Home Valuation Report is an in-depth analysis detailing your home's value as well as a comparison with similar homes in the area
Home Values in the Area
Average Home Value in this Area
Purchase History
| Date | Buyer | Sale Price | Title Company |
|---|---|---|---|
| Gellman Daniel | $1,315,000 | None Available | |
| Aspinall David R | $1,306,500 | The Judicial Title Insurance | |
| R & C Builders Llc | $350,000 | Chicago Title Insurance Co |
Source: Public Records
Mortgage History
| Date | Status | Borrower | Loan Amount |
|---|---|---|---|
| Previous Owner | Aspinall David R | $1,000,000 | |
| Previous Owner | R & C Builders Llc | $325,000 | |
| Closed | R & C Builders Llc | $500,000 |
Source: Public Records
Tax History Compared to Growth
Tax History
| Year | Tax Paid | Tax Assessment Tax Assessment Total Assessment is a certain percentage of the fair market value that is determined by local assessors to be the total taxable value of land and additions on the property. | Land | Improvement |
|---|---|---|---|---|
| 2024 | $32,364 | $660,000 | $200,000 | $460,000 |
| 2023 | $32,364 | $660,000 | $200,000 | $460,000 |
| 2022 | $32,155 | $630,000 | $200,000 | $430,000 |
| 2021 | $31,986 | $630,000 | $200,000 | $430,000 |
| 2020 | $20,313 | $630,000 | $200,000 | $430,000 |
| 2019 | $6,995 | $630,000 | $200,000 | $430,000 |
| 2018 | $19,593 | $630,000 | $200,000 | $430,000 |
| 2017 | $18,102 | $585,000 | $200,000 | $385,000 |
| 2016 | $17,069 | $585,000 | $200,000 | $385,000 |
| 2015 | -- | $585,000 | $200,000 | $385,000 |
| 2014 | -- | $585,000 | $200,000 | $385,000 |
Source: Public Records
Map
Nearby Homes
- 80 Halley Dr
- 2 Parkside Ct
- 325 Call Hollow Rd
- 329 Call Hollow Rd
- 11 Marino Blvd
- 66 Thiells Mount Ivy Rd
- 2 Jessup Ln
- 1 Jessup Ln
- 493 Willow Grove Rd
- 3 Jessup Ln
- 431 Willow Grove Rd
- 3 Mayer Ln
- 5 Laura Ln
- 1 Mayer Ln
- 570 Willow Grove Rd
- 197 Richard Ct
- 251 Quaker Rd
- 14 Klingher Ct
- 22 Halley Dr
- 117 Buckingham Ct Unit 117
- 11 Lakeview Ct
- 101 Overlook Rd
- 32 Lakeview Ct
- 9 Lakeview Ct
- 98 Overlook Rd
- 96 Overlook Rd
- 95 Overlook Rd
- 103 Overlook Rd
- 31 High Mountain Rd
- 31 High Mountain Rd
- 94 Overlook Rd
- 7 Lakeview Ct
- 5 Lakeview Ct
- 92 Overlook Rd
- 34 High Mountain Rd
- 3 Lakeview Ct
- 29 High Mountain Rd
- 93 Overlook Rd
- 32 High Mountain Rd
- 10 East Ct