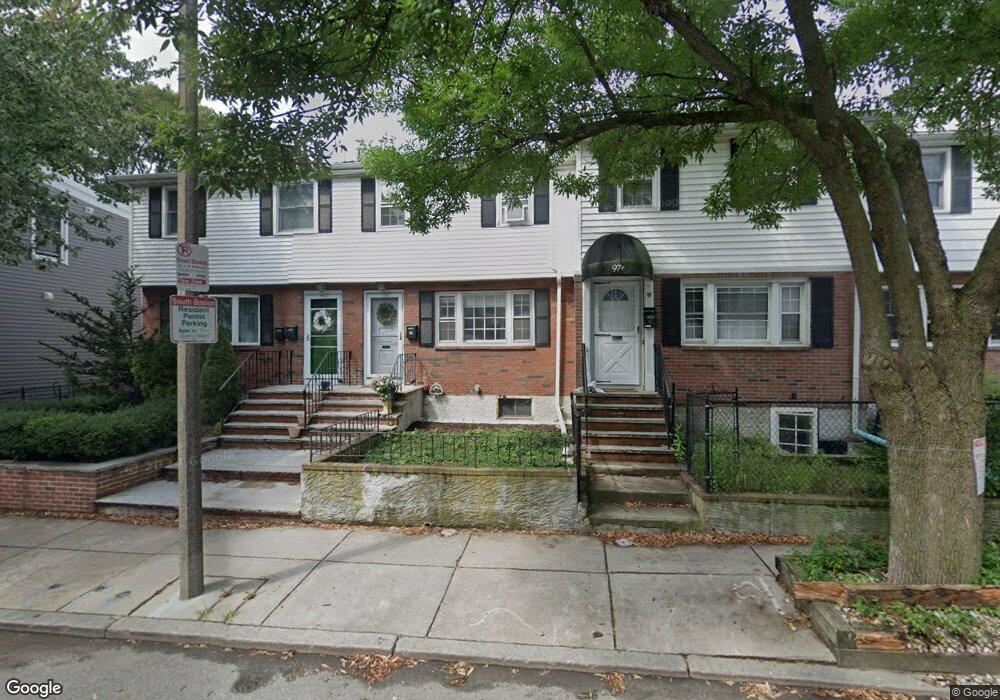
99 P St Unit A Boston, MA 02127
South Boston NeighborhoodEstimated Value: $766,114 - $1,211,000
2
Beds
1
Bath
1,098
Sq Ft
$867/Sq Ft
Est. Value
About This Home
This home is located at 99 P St Unit A, Boston, MA 02127 and is currently estimated at $951,779, approximately $866 per square foot. 99 P St Unit A is a home located in Suffolk County with nearby schools including South Boston Catholic Academy, Gate of Heaven Elementary School, and St Peter Academy.
Ownership History
Date
Name
Owned For
Owner Type
Purchase Details
Closed on
Dec 7, 1992
Sold by
Joyce Valiukonis George and Joyce Faliukonis
Bought by
Choueiri Farah and Choueiri Mary J
Current Estimated Value
Home Financials for this Owner
Home Financials are based on the most recent Mortgage that was taken out on this home.
Original Mortgage
$64,000
Interest Rate
8.22%
Mortgage Type
Purchase Money Mortgage
Create a Home Valuation Report for This Property
The Home Valuation Report is an in-depth analysis detailing your home's value as well as a comparison with similar homes in the area
Home Values in the Area
Average Home Value in this Area
Purchase History
| Date | Buyer | Sale Price | Title Company |
|---|---|---|---|
| Choueiri Farah | $80,000 | -- |
Source: Public Records
Mortgage History
| Date | Status | Borrower | Loan Amount |
|---|---|---|---|
| Open | Choueiri Farah | $64,000 | |
| Closed | Choueiri Farah | $64,000 |
Source: Public Records
Tax History Compared to Growth
Tax History
| Year | Tax Paid | Tax Assessment Tax Assessment Total Assessment is a certain percentage of the fair market value that is determined by local assessors to be the total taxable value of land and additions on the property. | Land | Improvement |
|---|---|---|---|---|
| 2025 | $8,779 | $758,100 | $291,700 | $466,400 |
| 2024 | $8,071 | $740,500 | $256,100 | $484,400 |
| 2023 | $7,361 | $685,400 | $237,000 | $448,400 |
| 2022 | $6,779 | $623,100 | $215,500 | $407,600 |
| 2021 | $6,455 | $605,000 | $209,200 | $395,800 |
| 2020 | $5,388 | $510,200 | $197,600 | $312,600 |
| 2019 | $5,120 | $485,800 | $155,100 | $330,700 |
| 2018 | $4,760 | $454,200 | $155,100 | $299,100 |
| 2017 | $4,580 | $432,500 | $155,100 | $277,400 |
| 2016 | $4,406 | $400,500 | $155,100 | $245,400 |
| 2015 | $4,297 | $354,800 | $139,400 | $215,400 |
| 2014 | $3,906 | $310,500 | $139,400 | $171,100 |
Source: Public Records
Map
Nearby Homes
- 901 E Broadway Unit 1
- 933 E Broadway
- 907 E 4th St Unit 2
- 915 E 4th St
- 945 E Broadway Unit 7
- 765 E 3rd St Unit 201
- 803 E 5th St Unit 1
- 52 O St Unit 3
- 37 Farragut Rd Unit 7
- 37 Farragut Rd Unit 6
- 37 Farragut Rd Unit Four
- 37 Farragut Rd Unit 3
- 37 Farragut Rd Unit 5
- 37 Farragut Rd Unit 2
- 852 E Broadway Unit 3
- 823 E 6th St Unit 5
- 733 E 3rd St
- 786 E 6th St Unit 788
- 33 Lennon Ct Unit 39
- 7 Kemble Place