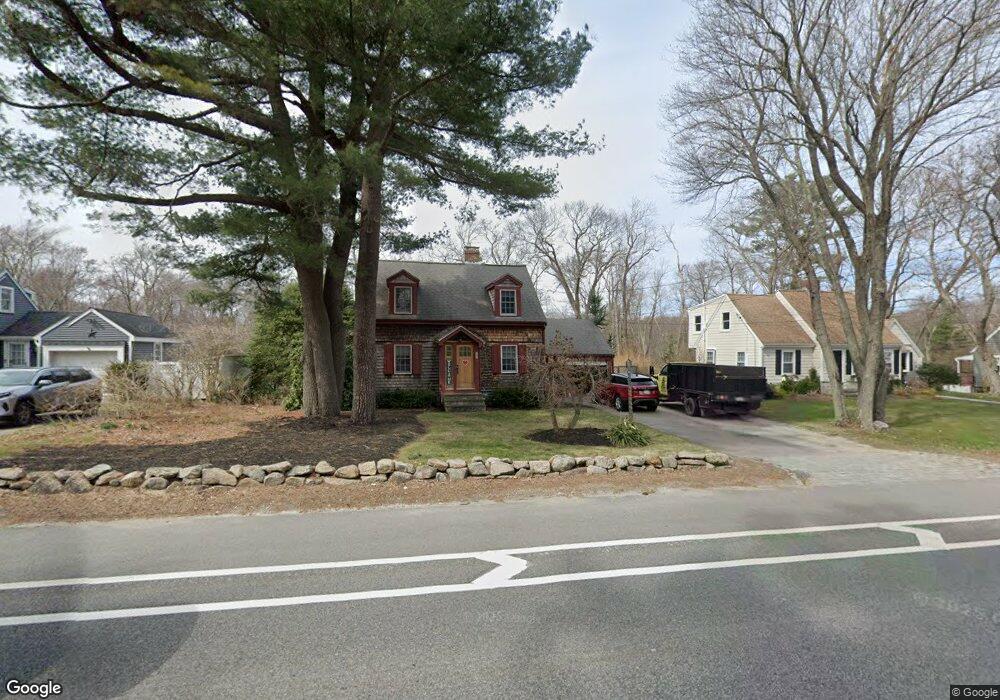
99 Park Ave W South Weymouth, MA 02190
South Weymouth NeighborhoodEstimated Value: $598,000 - $734,000
3
Beds
2
Baths
1,390
Sq Ft
$480/Sq Ft
Est. Value
About This Home
This home is located at 99 Park Ave W, South Weymouth, MA 02190 and is currently estimated at $667,063, approximately $479 per square foot. 99 Park Ave W is a home located in Norfolk County with nearby schools including Thomas V Nash, Abigail Adams Middle School, and Weymouth Middle School Chapman.
Ownership History
Date
Name
Owned For
Owner Type
Purchase Details
Closed on
Jul 15, 1999
Sold by
Knowles Donald B
Bought by
Macneil Donald and Macneil Lauren K
Current Estimated Value
Home Financials for this Owner
Home Financials are based on the most recent Mortgage that was taken out on this home.
Original Mortgage
$148,890
Outstanding Balance
$41,146
Interest Rate
7.39%
Mortgage Type
Purchase Money Mortgage
Estimated Equity
$625,917
Create a Home Valuation Report for This Property
The Home Valuation Report is an in-depth analysis detailing your home's value as well as a comparison with similar homes in the area
Home Values in the Area
Average Home Value in this Area
Purchase History
| Date | Buyer | Sale Price | Title Company |
|---|---|---|---|
| Macneil Donald | $153,500 | -- |
Source: Public Records
Mortgage History
| Date | Status | Borrower | Loan Amount |
|---|---|---|---|
| Open | Macneil Donald | $148,890 |
Source: Public Records
Tax History Compared to Growth
Tax History
| Year | Tax Paid | Tax Assessment Tax Assessment Total Assessment is a certain percentage of the fair market value that is determined by local assessors to be the total taxable value of land and additions on the property. | Land | Improvement |
|---|---|---|---|---|
| 2025 | $5,314 | $526,100 | $212,900 | $313,200 |
| 2024 | $5,147 | $501,200 | $202,800 | $298,400 |
| 2023 | $4,852 | $464,300 | $187,800 | $276,500 |
| 2022 | $4,728 | $412,600 | $173,900 | $238,700 |
| 2021 | $4,441 | $378,300 | $173,900 | $204,400 |
| 2020 | $4,198 | $352,200 | $173,900 | $178,300 |
| 2019 | $4,166 | $343,700 | $167,200 | $176,500 |
| 2018 | $4,035 | $322,800 | $159,200 | $163,600 |
| 2017 | $4,006 | $312,700 | $151,700 | $161,000 |
| 2016 | $3,849 | $300,700 | $145,800 | $154,900 |
| 2015 | $3,542 | $274,600 | $131,300 | $143,300 |
| 2014 | $3,506 | $263,600 | $135,700 | $127,900 |
Source: Public Records
Map
Nearby Homes
- 27 Park Ave
- 2 Mitchell Ln Unit B
- 24 Fisher Rd
- 16 Jay Rd
- 308 Forest St
- 92 Mercury St
- 120 Randolph St
- 45 Union St
- 193 Randolph St
- 50 Hollis St
- 68 Massapoag St Unit 7
- 18 Fountain Ln Unit 2
- 261 Pleasant St Unit 3
- 261 Pleasant St Unit 5
- 262 West St
- 211 Randolph St
- 255 West St
- 60 Greentree Ln Unit 38
- 55 Greentree Ln Unit 19
- 25 Wales Ave