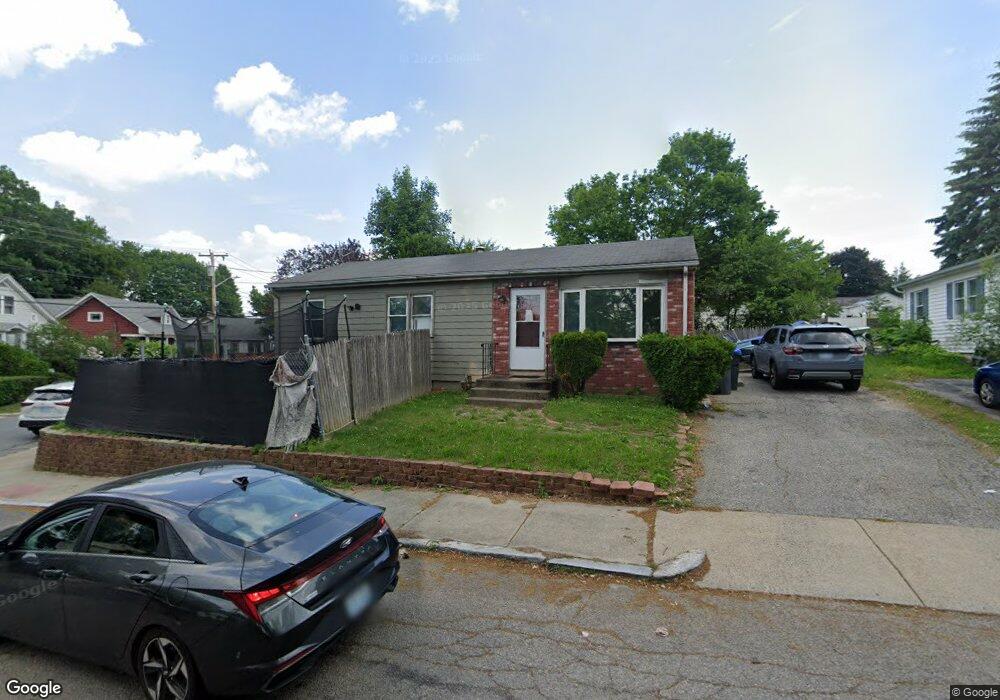
99 Phebe St Providence, RI 02904
Wanskuck NeighborhoodEstimated Value: $304,000 - $369,000
3
Beds
1
Bath
960
Sq Ft
$362/Sq Ft
Est. Value
About This Home
This home is located at 99 Phebe St, Providence, RI 02904 and is currently estimated at $347,776, approximately $362 per square foot. 99 Phebe St is a home located in Providence County with nearby schools including St. Augustine School, St. Pius V Catholic School, and The San Miguel School.
Ownership History
Date
Name
Owned For
Owner Type
Purchase Details
Closed on
Dec 19, 1997
Sold by
Yardley Group Inc
Bought by
Equity Finders Llc and Pasco Dev Llc
Current Estimated Value
Home Financials for this Owner
Home Financials are based on the most recent Mortgage that was taken out on this home.
Original Mortgage
$32,500
Interest Rate
7.14%
Purchase Details
Closed on
Dec 15, 1997
Sold by
Dawley Linda Anne
Bought by
Yardley Group Inc
Home Financials for this Owner
Home Financials are based on the most recent Mortgage that was taken out on this home.
Original Mortgage
$32,500
Interest Rate
7.14%
Create a Home Valuation Report for This Property
The Home Valuation Report is an in-depth analysis detailing your home's value as well as a comparison with similar homes in the area
Home Values in the Area
Average Home Value in this Area
Purchase History
| Date | Buyer | Sale Price | Title Company |
|---|---|---|---|
| Equity Finders Llc | $37,500 | -- | |
| Yardley Group Inc | $25,000 | -- |
Source: Public Records
Mortgage History
| Date | Status | Borrower | Loan Amount |
|---|---|---|---|
| Open | Yardley Group Inc | $121,484 | |
| Closed | Yardley Group Inc | $95,200 | |
| Closed | Yardley Group Inc | $64,800 | |
| Closed | Yardley Group Inc | $32,500 |
Source: Public Records
Tax History
| Year | Tax Paid | Tax Assessment Tax Assessment Total Assessment is a certain percentage of the fair market value that is determined by local assessors to be the total taxable value of land and additions on the property. | Land | Improvement |
|---|---|---|---|---|
| 2025 | $2,725 | $324,400 | $163,700 | $160,700 |
| 2024 | $4,221 | $230,000 | $89,800 | $140,200 |
| 2023 | $4,221 | $230,000 | $89,800 | $140,200 |
| 2022 | $4,094 | $230,000 | $89,800 | $140,200 |
| 2021 | $3,448 | $140,400 | $45,600 | $94,800 |
| 2020 | $3,448 | $140,400 | $45,600 | $94,800 |
| 2019 | $3,448 | $140,400 | $45,600 | $94,800 |
| 2018 | $2,979 | $93,200 | $38,700 | $54,500 |
| 2017 | $2,979 | $93,200 | $38,700 | $54,500 |
| 2016 | $2,979 | $93,200 | $38,700 | $54,500 |
| 2015 | $2,860 | $86,400 | $38,700 | $47,700 |
| 2014 | $2,916 | $86,400 | $38,700 | $47,700 |
| 2013 | $2,916 | $86,400 | $38,700 | $47,700 |
Source: Public Records
Map
Nearby Homes
- 115 Hazael St
- 1039 Douglas Ave
- 31 Joseph St
- 25 Hymer St
- 835 River Ave
- 30 Oneil St
- 873 Douglas Ave
- 876 Douglas Ave
- 23 Concannon St
- 871 Douglas Ave
- 860 Douglas Ave
- 1166 Douglas Ave
- 0 Wainwright St
- 73 Wainwright St
- 252 Gentian Ave
- 272 Veazie St
- 160 Cumberland St
- 825 Douglas Ave
- 82 Lucille St
- 797 Academy Ave