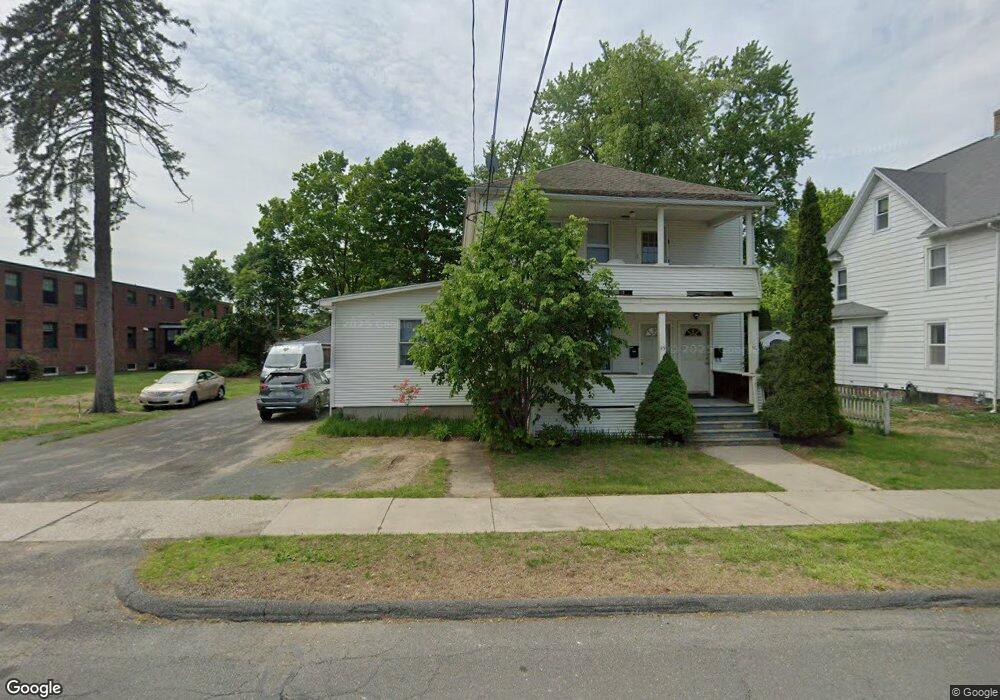
99 Pine St West Springfield, MA 01089
Estimated Value: $375,011 - $443,000
4
Beds
2
Baths
2,976
Sq Ft
$136/Sq Ft
Est. Value
About This Home
This home is located at 99 Pine St, West Springfield, MA 01089 and is currently estimated at $405,503, approximately $136 per square foot. 99 Pine St is a home located in Hampden County with nearby schools including West Springfield High School and St Thomas The Apostle School.
Ownership History
Date
Name
Owned For
Owner Type
Purchase Details
Closed on
Feb 23, 1993
Sold by
Butler William K and Chemical Bk
Bought by
Kukharchuk Anatoly and Kukharchuk Olga
Current Estimated Value
Home Financials for this Owner
Home Financials are based on the most recent Mortgage that was taken out on this home.
Original Mortgage
$63,450
Interest Rate
8.06%
Mortgage Type
Purchase Money Mortgage
Create a Home Valuation Report for This Property
The Home Valuation Report is an in-depth analysis detailing your home's value as well as a comparison with similar homes in the area
Home Values in the Area
Average Home Value in this Area
Purchase History
| Date | Buyer | Sale Price | Title Company |
|---|---|---|---|
| Kukharchuk Anatoly | $70,500 | -- |
Source: Public Records
Mortgage History
| Date | Status | Borrower | Loan Amount |
|---|---|---|---|
| Open | Kukharchuk Anatoly | $88,500 | |
| Closed | Kukharchuk Anatoly | $24,000 | |
| Closed | Kukharchuk Anatoly | $63,450 |
Source: Public Records
Tax History
| Year | Tax Paid | Tax Assessment Tax Assessment Total Assessment is a certain percentage of the fair market value that is determined by local assessors to be the total taxable value of land and additions on the property. | Land | Improvement |
|---|---|---|---|---|
| 2025 | $4,935 | $331,900 | $102,900 | $229,000 |
| 2024 | $4,915 | $331,900 | $102,900 | $229,000 |
| 2023 | $4,401 | $283,200 | $100,700 | $182,500 |
| 2022 | $4,317 | $273,900 | $91,400 | $182,500 |
| 2021 | $3,733 | $220,900 | $85,600 | $135,300 |
| 2020 | $3,753 | $220,900 | $85,600 | $135,300 |
| 2019 | $3,746 | $220,900 | $85,600 | $135,300 |
| 2018 | $3,766 | $220,900 | $85,600 | $135,300 |
| 2017 | $3,766 | $220,900 | $85,600 | $135,300 |
| 2016 | $3,665 | $215,700 | $80,400 | $135,300 |
| 2015 | $3,595 | $211,600 | $78,800 | $132,800 |
| 2014 | $873 | $211,600 | $78,800 | $132,800 |
Source: Public Records
Map
Nearby Homes
- 105 Pine St
- 111 Pine St
- 98 Pine St
- 108 Pine St
- 92 Pine St
- 94 Pine St
- 117 Pine St
- 114 Pine St
- 123 Pine St
- 120 Pine St
- 119 Chestnut St
- 119 Chestnut St Unit 119 Chestnut ST
- 129 Chestnut St
- 80 Pine St
- 80-84 Pine St
- 80 Pine St Unit 2
- 80 Pine St Unit 1
- 84 Pine St Unit 1
- 121 Chestnut St Unit 121
- 111 Chestnut St
Your Personal Tour Guide
Ask me questions while you tour the home.