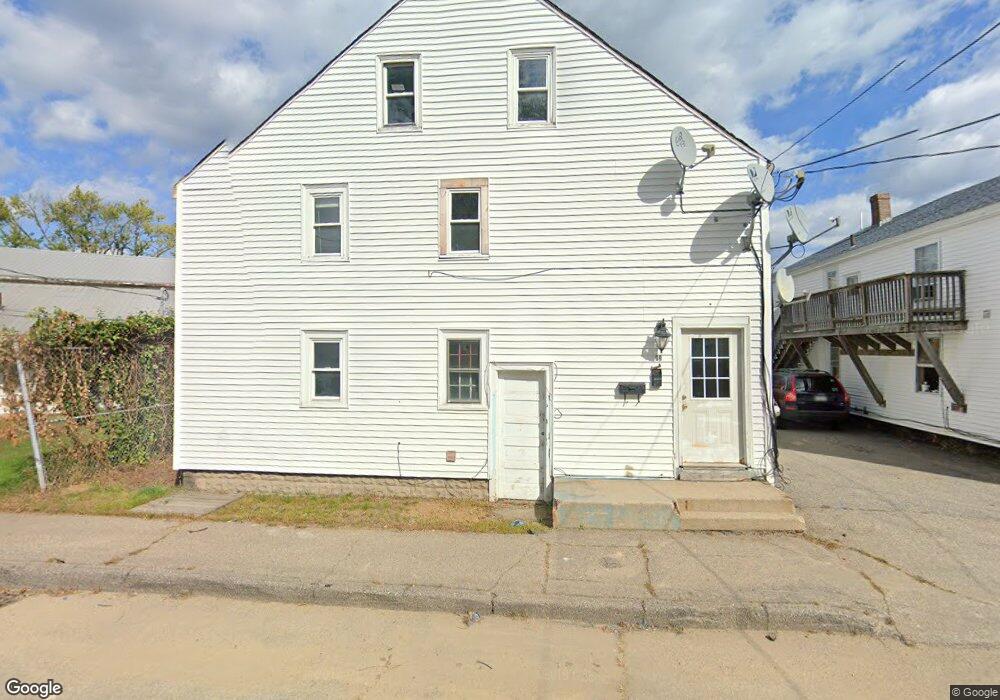
99 River St Sanford, ME 04073
Estimated Value: $271,133 - $349,000
4
Beds
2
Baths
1,800
Sq Ft
$182/Sq Ft
Est. Value
About This Home
This home is located at 99 River St, Sanford, ME 04073 and is currently estimated at $327,533, approximately $181 per square foot. 99 River St is a home located in York County with nearby schools including St Thomas Consolidated School and Sanford Christian Academy.
Ownership History
Date
Name
Owned For
Owner Type
Purchase Details
Closed on
Dec 28, 2007
Sold by
Wells Fargo Bank Na Tr
Bought by
Baye Ayesha
Current Estimated Value
Home Financials for this Owner
Home Financials are based on the most recent Mortgage that was taken out on this home.
Original Mortgage
$67,500
Interest Rate
6.27%
Mortgage Type
Purchase Money Mortgage
Purchase Details
Closed on
Mar 22, 2007
Sold by
Winfrey Darrick and Hsbc Bank Usa Tr
Bought by
Hsbc Bank Usa Tr
Create a Home Valuation Report for This Property
The Home Valuation Report is an in-depth analysis detailing your home's value as well as a comparison with similar homes in the area
Home Values in the Area
Average Home Value in this Area
Purchase History
| Date | Buyer | Sale Price | Title Company |
|---|---|---|---|
| Baye Ayesha | -- | -- | |
| Hsbc Bank Usa Tr | -- | -- |
Source: Public Records
Mortgage History
| Date | Status | Borrower | Loan Amount |
|---|---|---|---|
| Open | Hsbc Bank Usa Tr | $112,000 | |
| Closed | Hsbc Bank Usa Tr | $67,500 |
Source: Public Records
Tax History Compared to Growth
Tax History
| Year | Tax Paid | Tax Assessment Tax Assessment Total Assessment is a certain percentage of the fair market value that is determined by local assessors to be the total taxable value of land and additions on the property. | Land | Improvement |
|---|---|---|---|---|
| 2025 | $3,228 | $188,800 | $24,800 | $164,000 |
| 2024 | $3,047 | $188,800 | $24,800 | $164,000 |
| 2023 | $2,833 | $187,100 | $24,800 | $162,300 |
| 2022 | $2,769 | $187,100 | $24,800 | $162,300 |
| 2021 | $2,434 | $133,900 | $24,800 | $109,100 |
| 2020 | $2,411 | $119,600 | $24,800 | $94,800 |
| 2019 | $2,341 | $113,100 | $24,800 | $88,300 |
| 2018 | $2,415 | $117,800 | $24,800 | $93,000 |
| 2017 | $2,443 | $117,800 | $24,800 | $93,000 |
| 2016 | $2,201 | $96,800 | $24,800 | $72,000 |
| 2015 | $2,164 | $98,200 | $24,800 | $73,400 |
| 2014 | $2,082 | $94,700 | $24,800 | $69,900 |
| 2013 | -- | $96,300 | $24,800 | $71,500 |
Source: Public Records
Map
Nearby Homes