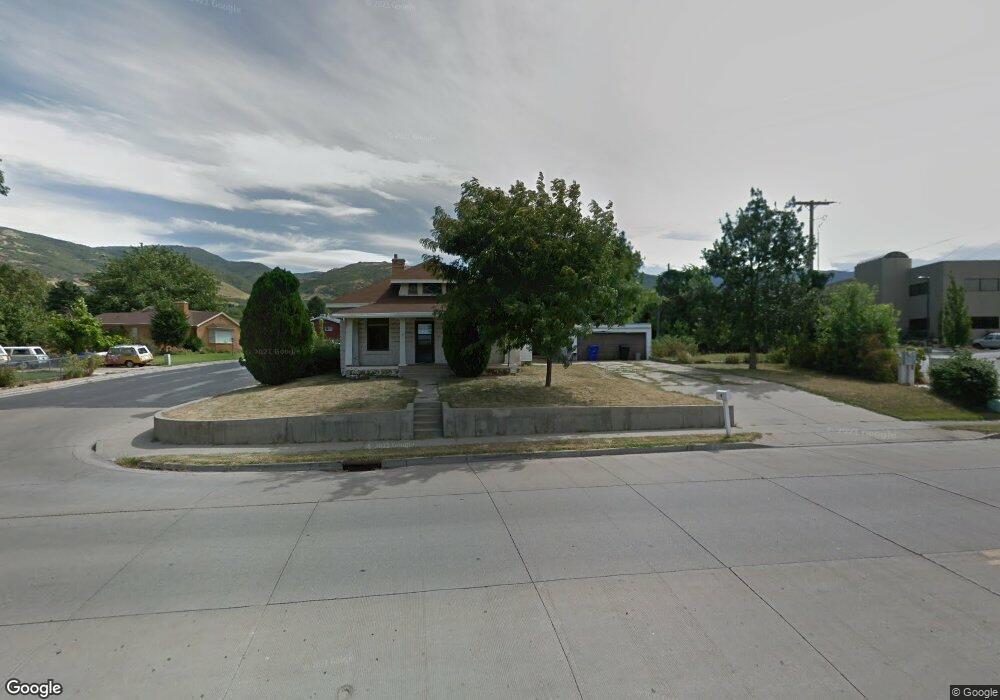
99 S 400 E Bountiful, UT 84010
Estimated Value: $448,000 - $506,000
3
Beds
1
Bath
1,495
Sq Ft
$318/Sq Ft
Est. Value
About This Home
This home is located at 99 S 400 E, Bountiful, UT 84010 and is currently estimated at $475,176, approximately $317 per square foot. 99 S 400 E is a home located in Davis County with nearby schools including Holbrook Elementary School, Millcreek Junior High School, and Bountiful High School.
Ownership History
Date
Name
Owned For
Owner Type
Purchase Details
Closed on
Mar 8, 2021
Sold by
Furch Eliza and Preece Eliza
Bought by
Furch Eliza
Current Estimated Value
Home Financials for this Owner
Home Financials are based on the most recent Mortgage that was taken out on this home.
Original Mortgage
$272,000
Outstanding Balance
$243,274
Interest Rate
2.7%
Mortgage Type
New Conventional
Estimated Equity
$231,902
Purchase Details
Closed on
Oct 30, 2019
Sold by
Mercer Tyson
Bought by
Preece Eliza
Home Financials for this Owner
Home Financials are based on the most recent Mortgage that was taken out on this home.
Original Mortgage
$271,503
Interest Rate
3.7%
Mortgage Type
New Conventional
Purchase Details
Closed on
Oct 10, 2017
Sold by
Bluemountain Inc
Bought by
Mercer Tyson
Create a Home Valuation Report for This Property
The Home Valuation Report is an in-depth analysis detailing your home's value as well as a comparison with similar homes in the area
Purchase History
| Date | Buyer | Sale Price | Title Company |
|---|---|---|---|
| Furch Eliza | -- | Vantage Title Ins | |
| Preece Eliza | -- | Us Title Company Of | |
| Mercer Tyson | -- | -- |
Source: Public Records
Mortgage History
| Date | Status | Borrower | Loan Amount |
|---|---|---|---|
| Open | Furch Eliza | $272,000 | |
| Closed | Preece Eliza | $271,503 |
Source: Public Records
Tax History
| Year | Tax Paid | Tax Assessment Tax Assessment Total Assessment is a certain percentage of the fair market value that is determined by local assessors to be the total taxable value of land and additions on the property. | Land | Improvement |
|---|---|---|---|---|
| 2025 | $2,593 | $228,800 | $112,532 | $116,268 |
| 2024 | $2,423 | $222,750 | $103,684 | $119,066 |
| 2023 | $2,318 | $387,000 | $188,911 | $198,089 |
| 2022 | $2,426 | $222,750 | $100,721 | $122,029 |
| 2021 | $2,258 | $318,000 | $149,778 | $168,222 |
| 2020 | $1,983 | $279,000 | $136,361 | $142,639 |
| 2019 | $1,872 | $243,000 | $132,302 | $110,698 |
| 2018 | $1,700 | $219,000 | $123,174 | $95,826 |
| 2016 | $1,382 | $99,220 | $40,153 | $59,067 |
| 2015 | $1,340 | $90,640 | $40,153 | $50,487 |
| 2014 | $1,503 | $106,515 | $40,153 | $66,362 |
| 2013 | -- | $94,680 | $49,115 | $45,565 |
Source: Public Records
Map
Nearby Homes
- 255 E 400 S
- 698 E 200 S
- 456 E 500 S
- 520 S Orchard Dr Unit 17
- 683 E 100 N
- 275 E Peach Ln S
- 357 S 100 E
- 323 Peach Ln
- 129 N 800 E
- 6 N 800 E
- 453 N 400 E Unit 7-D
- 513 N 400 E Unit 14B
- 545 S 100 E
- 49 E 200 N Unit 4
- 55 E 200 N Unit 2
- 41 E 200 N Unit 6
- 51 E 200 N Unit 3
- 254 N Main St
- 256 N Main St
- 252 N Main St
Your Personal Tour Guide
Ask me questions while you tour the home.