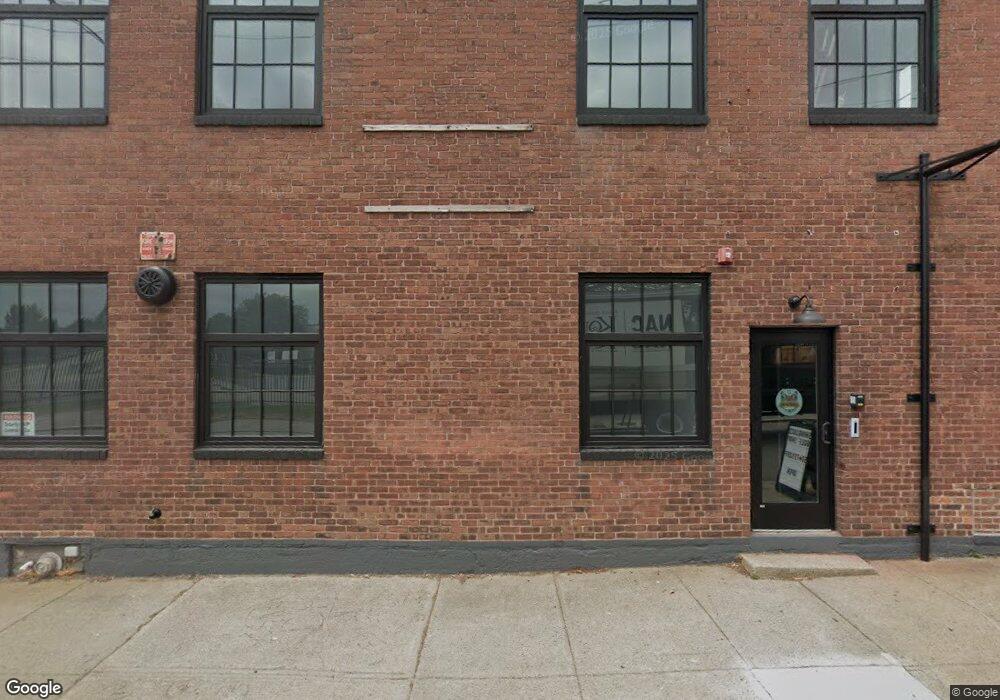
99 S Bend St Pawtucket, RI 02860
Quality Hill NeighborhoodEstimated Value: $1,068,137
Studio
--
Bath
1,500
Sq Ft
$712/Sq Ft
Est. Value
About This Home
This home is located at 99 S Bend St, Pawtucket, RI 02860 and is currently estimated at $1,068,137, approximately $712 per square foot. 99 S Bend St is a home located in Providence County with nearby schools including International Charter School, Blackstone Academy Charter School, and Saint Teresa Catholic Elementary School.
Ownership History
Date
Name
Owned For
Owner Type
Purchase Details
Closed on
Feb 15, 2022
Sold by
441 South Bound Llc
Bought by
Badgar Properties Llc
Current Estimated Value
Home Financials for this Owner
Home Financials are based on the most recent Mortgage that was taken out on this home.
Original Mortgage
$588,750
Outstanding Balance
$540,395
Interest Rate
3.55%
Mortgage Type
Purchase Money Mortgage
Estimated Equity
$527,742
Purchase Details
Closed on
Feb 1, 2013
Sold by
Tangomill Llc
Bought by
441 South Bound Llc
Home Financials for this Owner
Home Financials are based on the most recent Mortgage that was taken out on this home.
Original Mortgage
$363,750
Interest Rate
3.41%
Mortgage Type
Commercial
Purchase Details
Closed on
Feb 4, 1994
Sold by
Resnick Lawrence J Est
Bought by
Tegu Peter D and Tegu Nina
Create a Home Valuation Report for This Property
The Home Valuation Report is an in-depth analysis detailing your home's value as well as a comparison with similar homes in the area
Home Values in the Area
Average Home Value in this Area
Purchase History
| Date | Buyer | Sale Price | Title Company |
|---|---|---|---|
| Badgar Properties Llc | $785,000 | None Available | |
| Badgar Properties Llc | $785,000 | None Available | |
| 441 South Bound Llc | $485,000 | -- | |
| 441 South Bound Llc | $485,000 | -- | |
| Tegu Peter D | $50,000 | -- | |
| Tegu Peter D | $50,000 | -- |
Source: Public Records
Mortgage History
| Date | Status | Borrower | Loan Amount |
|---|---|---|---|
| Open | Badgar Properties Llc | $588,750 | |
| Closed | Badgar Properties Llc | $588,750 | |
| Previous Owner | Tegu Peter D | $363,750 | |
| Previous Owner | Tegu Peter D | $25,000 |
Source: Public Records
Tax History
| Year | Tax Paid | Tax Assessment Tax Assessment Total Assessment is a certain percentage of the fair market value that is determined by local assessors to be the total taxable value of land and additions on the property. | Land | Improvement |
|---|---|---|---|---|
| 2025 | $16,648 | $723,500 | $101,400 | $622,100 |
| 2024 | $15,628 | $723,500 | $101,400 | $622,100 |
| 2023 | $16,557 | $558,400 | $84,100 | $474,300 |
| 2022 | $16,205 | $558,400 | $84,100 | $474,300 |
| 2021 | $16,205 | $558,400 | $84,100 | $474,300 |
| 2020 | $16,515 | $479,100 | $84,100 | $395,000 |
| 2019 | $16,515 | $479,100 | $84,100 | $395,000 |
| 2018 | $15,911 | $479,100 | $84,100 | $395,000 |
| 2017 | $16,045 | $460,000 | $83,400 | $376,600 |
| 2016 | $15,461 | $460,000 | $83,400 | $376,600 |
| 2015 | $15,461 | $460,000 | $83,400 | $376,600 |
| 2014 | $13,127 | $425,100 | $90,600 | $334,500 |
Source: Public Records
Map
Nearby Homes
- 0 S Bend St
- 131 Johnson St
- 316 Division St
- 140 Johnson St
- 89 S Bend St
- 314 Division St
- 136 Johnson St
- 136 Johnson St Unit 1
- 125 Johnson St
- 130 Johnson St
- 306 Division St
- 81 S Bend St
- 124 Johnson St
- 124 Johnson St Unit 3
- 124 Johnson St Unit 2
- 124 Johnson St Unit 1
- 298 Division St
- 83 S Bend St
- 137 S Bend St
- 137 S Bend St Unit 137
Your Personal Tour Guide
Ask me questions while you tour the home.