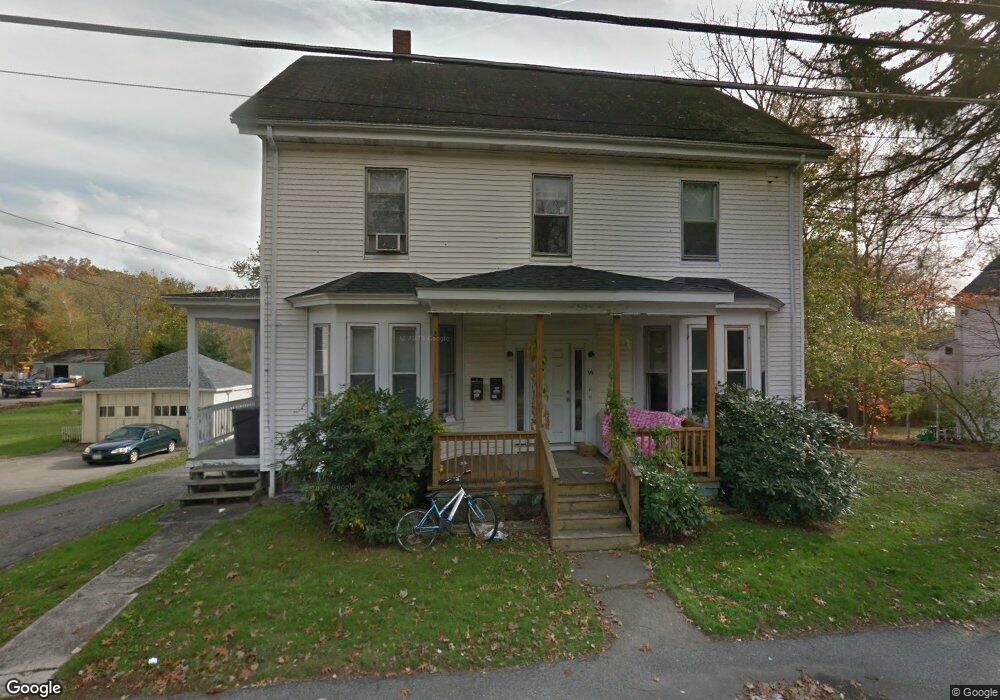
99 Salem St Woburn, MA 01801
Downtown Woburn NeighborhoodEstimated Value: $672,000 - $984,000
7
Beds
4
Baths
2,472
Sq Ft
$333/Sq Ft
Est. Value
About This Home
This home is located at 99 Salem St, Woburn, MA 01801 and is currently estimated at $821,981, approximately $332 per square foot. 99 Salem St is a home located in Middlesex County with nearby schools including Malcolm White Elementary School, John F. Kennedy Middle School, and Woburn High School.
Ownership History
Date
Name
Owned For
Owner Type
Purchase Details
Closed on
Apr 27, 2012
Sold by
Capelo Juvenal A and Capelo Maria R
Bought by
99 Salem Streete Rt and Scribner
Current Estimated Value
Home Financials for this Owner
Home Financials are based on the most recent Mortgage that was taken out on this home.
Original Mortgage
$287,200
Outstanding Balance
$197,662
Interest Rate
3.91%
Mortgage Type
New Conventional
Estimated Equity
$624,319
Purchase Details
Closed on
Dec 3, 1998
Sold by
Rapuano Joseph and Rapuano Vera M
Bought by
Capelo Juvenal A and Capelo Maria R
Home Financials for this Owner
Home Financials are based on the most recent Mortgage that was taken out on this home.
Original Mortgage
$142,400
Interest Rate
6.68%
Mortgage Type
Purchase Money Mortgage
Create a Home Valuation Report for This Property
The Home Valuation Report is an in-depth analysis detailing your home's value as well as a comparison with similar homes in the area
Home Values in the Area
Average Home Value in this Area
Purchase History
| Date | Buyer | Sale Price | Title Company |
|---|---|---|---|
| 99 Salem Streete Rt | $359,000 | -- | |
| 99 Salem Streete Rt | $359,000 | -- | |
| Capelo Juvenal A | $178,000 | -- |
Source: Public Records
Mortgage History
| Date | Status | Borrower | Loan Amount |
|---|---|---|---|
| Open | 99 Salem Streete Rt | $287,200 | |
| Closed | Capelo Juvenal A | $287,200 | |
| Previous Owner | Capelo Juvenal A | $142,400 |
Source: Public Records
Tax History Compared to Growth
Tax History
| Year | Tax Paid | Tax Assessment Tax Assessment Total Assessment is a certain percentage of the fair market value that is determined by local assessors to be the total taxable value of land and additions on the property. | Land | Improvement |
|---|---|---|---|---|
| 2025 | $5,721 | $669,900 | $335,100 | $334,800 |
| 2024 | $5,201 | $645,300 | $319,100 | $326,200 |
| 2023 | $5,241 | $602,400 | $290,100 | $312,300 |
| 2022 | $5,111 | $547,200 | $252,300 | $294,900 |
| 2021 | $6,260 | $535,200 | $240,300 | $294,900 |
| 2020 | $6,074 | $491,900 | $240,300 | $251,600 |
| 2019 | $5,903 | $456,200 | $228,900 | $227,300 |
| 2018 | $4,278 | $432,600 | $210,000 | $222,600 |
| 2017 | $3,771 | $379,400 | $200,100 | $179,300 |
| 2016 | $3,474 | $345,700 | $187,000 | $158,700 |
| 2015 | $3,392 | $333,500 | $174,800 | $158,700 |
| 2014 | $3,431 | $328,600 | $174,800 | $153,800 |
Source: Public Records
Map
Nearby Homes
- 9 Wade Ave
- 74 Beach St Unit 6-12
- 74 Beach St Unit 3
- 18 Church St Unit 2
- 2 Eastern Ave
- 14 Church Ave
- 14 Church Ave Unit 2
- 34 Union St
- 477 Main St
- 1 Boline Place
- 12 Mishawum Rd
- 602 Main St Unit 1
- 18 Gardner Ave
- 11 Hovey St
- 21 Franklin St
- 62 Jefferson Ave
- 38 Middle St
- 7 Prospect St
- 37 1/2 Chestnut St
- 462 Place Ln