G
Seller's Agent in 2021
Gail Germain Martis
Sotheby's International Realty
(508) 776-8311
4 in this area
9 Total Sales
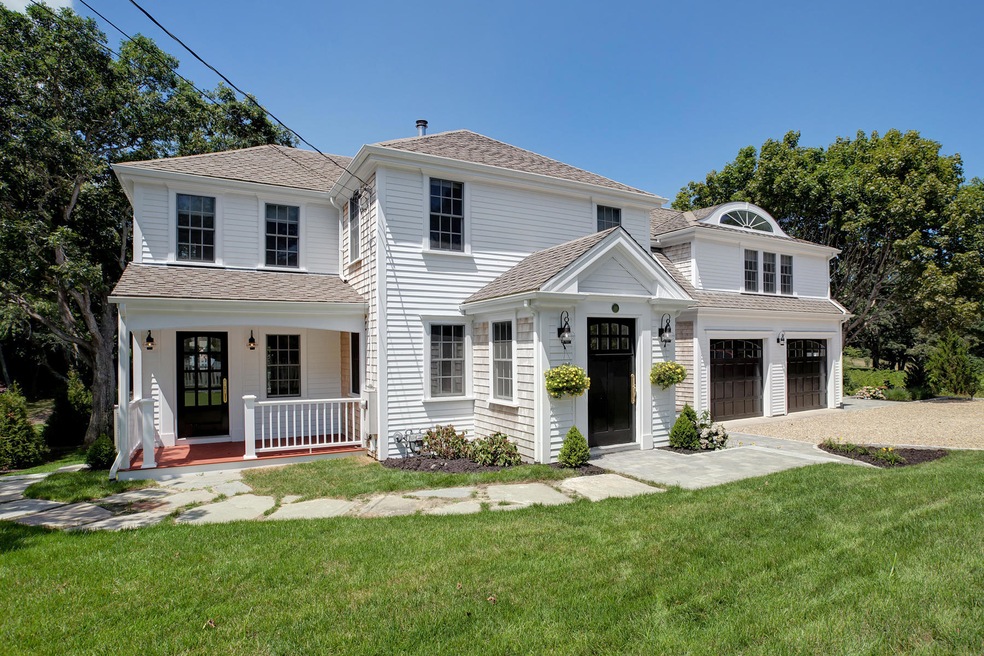
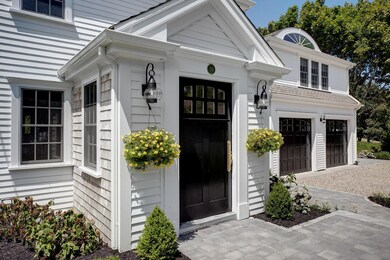

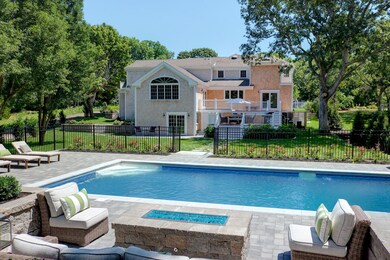
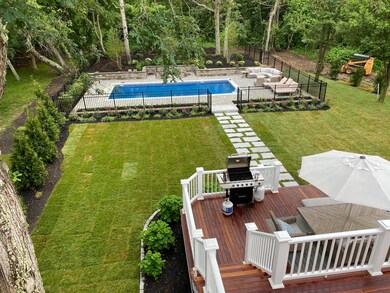

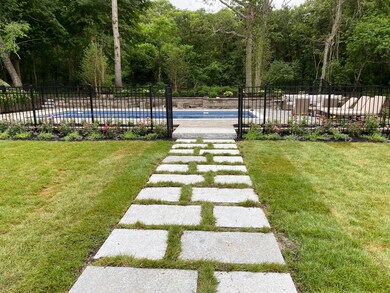
Impeccably renovated home that blends character with crisp and clean style. In addition to cosmetic esthetics, the mechanics, landscaping and high-end pool areas are all updated/added, as well. This village property abuts conservation land and is within all the amenities that Osterville has to offer. Use as beach house, year-round residence or income property ($7000/week history). All listing information to be verified. Showings to begin October 4th.
Last Agent to Sell the Property
Sotheby's International Realty License #9072315 Listed on: 08/10/2020

Last Buyer's Agent
Member Non
cci.unknownoffice
| Date | Type | Sale Price | Title Company |
|---|---|---|---|
| Not Resolvable | $1,668,145 | None Available | |
| Not Resolvable | $575,000 | None Available | |
| Deed | -- | -- | |
| Not Resolvable | $572,250 | -- | |
| Foreclosure Deed | $697,000 | -- | |
| Deed | -- | -- | |
| Deed | -- | -- | |
| Deed | $130,000 | -- | |
| Deed | $92,500 | -- | |
| Foreclosure Deed | $130,000 | -- |
| Date | Status | Loan Amount | Loan Type |
|---|---|---|---|
| Open | $1,167,000 | Purchase Money Mortgage | |
| Previous Owner | $431,250 | New Conventional | |
| Previous Owner | $550,000 | Commercial | |
| Previous Owner | $199,000 | No Value Available | |
| Previous Owner | $9,999,999 | No Value Available | |
| Previous Owner | $150,000 | No Value Available | |
| Previous Owner | $810,000 | No Value Available | |
| Previous Owner | $140,000 | No Value Available | |
| Previous Owner | $581,250 | Purchase Money Mortgage | |
| Previous Owner | $395,000 | No Value Available | |
| Previous Owner | $330,000 | No Value Available |
| Date | Event | Price | Change | Sq Ft Price |
|---|---|---|---|---|
| 01/25/2021 01/25/21 | Sold | $1,668,000 | +4.6% | $502 / Sq Ft |
| 10/29/2020 10/29/20 | Pending | -- | -- | -- |
| 08/14/2020 08/14/20 | For Sale | $1,595,000 | +177.4% | $480 / Sq Ft |
| 12/09/2019 12/09/19 | Sold | $575,000 | -30.7% | $173 / Sq Ft |
| 11/11/2019 11/11/19 | Pending | -- | -- | -- |
| 09/04/2019 09/04/19 | For Sale | $829,900 | +45.0% | $250 / Sq Ft |
| 11/05/2018 11/05/18 | Sold | $572,250 | -3.3% | $172 / Sq Ft |
| 08/23/2018 08/23/18 | Pending | -- | -- | -- |
| 08/10/2018 08/10/18 | Price Changed | $591,900 | -9.9% | $178 / Sq Ft |
| 07/13/2018 07/13/18 | For Sale | $656,900 | -- | $198 / Sq Ft |
| Year | Tax Paid | Tax Assessment Tax Assessment Total Assessment is a certain percentage of the fair market value that is determined by local assessors to be the total taxable value of land and additions on the property. | Land | Improvement |
|---|---|---|---|---|
| 2025 | $15,390 | $1,902,400 | $340,000 | $1,562,400 |
| 2024 | $14,608 | $1,870,400 | $340,000 | $1,530,400 |
| 2023 | $13,470 | $1,615,100 | $316,100 | $1,299,000 |
| 2022 | $8,010 | $830,900 | $218,500 | $612,400 |
| 2021 | $7,850 | $748,300 | $239,400 | $508,900 |
| 2020 | $6,933 | $632,600 | $239,400 | $393,200 |
| 2019 | $6,823 | $604,900 | $249,800 | $355,100 |
| 2018 | $4,815 | $542,600 | $252,000 | $290,600 |
| 2017 | $5,616 | $521,900 | $252,000 | $269,900 |
| 2016 | $5,713 | $524,100 | $254,200 | $269,900 |
| 2015 | $6,038 | $556,500 | $247,700 | $308,800 |
G
Seller's Agent in 2021
Gail Germain Martis
Sotheby's International Realty
(508) 776-8311
4 in this area
9 Total Sales
M
Buyer's Agent in 2021
Member Non
cci.unknownoffice
C
Seller's Agent in 2019
Chuck Tuttle
Kinlin Grover Real Estate
T
Seller's Agent in 2018
The Ponte Group
Keller Williams South Watuppa
(508) 677-3233
1 in this area
750 Total Sales
Seller Co-Listing Agent in 2018
Clifford Ponte
Keller Williams South Watuppa
(508) 642-4802
1 in this area
477 Total Sales
N
Buyer's Agent in 2018
Non Member
Non Member Office
Source: Cape Cod & Islands Association of REALTORS®
MLS Number: 22005223
APN: OSTE-000165-000000-000037-000002
Disclaimer: Certain information contained herein is derived from information provided by parties other than Homes.com. All information provided is deemed reliable, but is not guaranteed to be accurate and should be independently verified.
![]() All data relating to real estate for sale on this page comes from the Broker Reciprocity (BR) of the Cape Cod & Islands Multiple Listing Service, Inc. Detailed information about real estate listings held by brokerage firms other than CC&I Assoc. of REALTORS®, Inc. includes the name of the listing company. Neither the listing company nor CC&I Assoc. of REALTORS®, Inc. shall be responsible for any typographical errors, misinformation, misprints and shall be held totally harmless. The Broker providing this data believes it to be correct, but advises interested parties to confirm any item before relying on it in a purchase decision. All properties are subject to prior sale, changes, or withdrawal. Copyright 2025 © Cape Cod & Islands Multiple Listing Service, Inc. All rights reserved.
All data relating to real estate for sale on this page comes from the Broker Reciprocity (BR) of the Cape Cod & Islands Multiple Listing Service, Inc. Detailed information about real estate listings held by brokerage firms other than CC&I Assoc. of REALTORS®, Inc. includes the name of the listing company. Neither the listing company nor CC&I Assoc. of REALTORS®, Inc. shall be responsible for any typographical errors, misinformation, misprints and shall be held totally harmless. The Broker providing this data believes it to be correct, but advises interested parties to confirm any item before relying on it in a purchase decision. All properties are subject to prior sale, changes, or withdrawal. Copyright 2025 © Cape Cod & Islands Multiple Listing Service, Inc. All rights reserved.