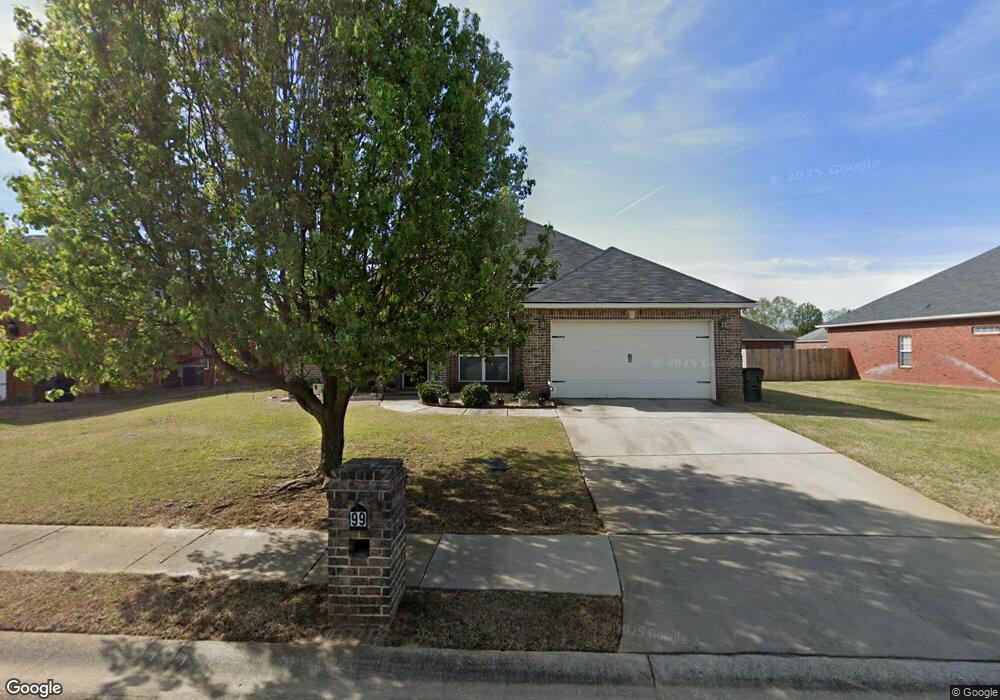
99 Trickum Ct Warner Robins, GA 31088
Estimated Value: $273,385 - $323,000
3
Beds
2
Baths
1,926
Sq Ft
$156/Sq Ft
Est. Value
About This Home
This home is located at 99 Trickum Ct, Warner Robins, GA 31088 and is currently estimated at $301,096, approximately $156 per square foot. 99 Trickum Ct is a home located in Houston County with nearby schools including Lake Joy Primary School, Lake Joy Elementary School, and Feagin Mill Middle School.
Ownership History
Date
Name
Owned For
Owner Type
Purchase Details
Closed on
Aug 31, 2006
Sold by
Prestige Builders Inc
Bought by
Mcclain Jamie
Current Estimated Value
Home Financials for this Owner
Home Financials are based on the most recent Mortgage that was taken out on this home.
Original Mortgage
$147,120
Outstanding Balance
$85,581
Interest Rate
6.67%
Mortgage Type
New Conventional
Estimated Equity
$215,515
Purchase Details
Closed on
May 10, 2006
Sold by
Jenlar Inc
Bought by
Prestige Builders Inc
Home Financials for this Owner
Home Financials are based on the most recent Mortgage that was taken out on this home.
Original Mortgage
$147,680
Interest Rate
6.41%
Mortgage Type
Construction
Purchase Details
Closed on
Mar 24, 2006
Sold by
Jaros Development Llc
Bought by
Jenlar Inc
Home Financials for this Owner
Home Financials are based on the most recent Mortgage that was taken out on this home.
Original Mortgage
$147,680
Interest Rate
6.41%
Mortgage Type
Construction
Create a Home Valuation Report for This Property
The Home Valuation Report is an in-depth analysis detailing your home's value as well as a comparison with similar homes in the area
Home Values in the Area
Average Home Value in this Area
Purchase History
| Date | Buyer | Sale Price | Title Company |
|---|---|---|---|
| Mcclain Jamie | $183,900 | None Available | |
| Prestige Builders Inc | $23,900 | -- | |
| Jenlar Inc | $22,000 | -- |
Source: Public Records
Mortgage History
| Date | Status | Borrower | Loan Amount |
|---|---|---|---|
| Open | Mcclain Jamie | $147,120 | |
| Previous Owner | Prestige Builders Inc | $147,680 |
Source: Public Records
Tax History
| Year | Tax Paid | Tax Assessment Tax Assessment Total Assessment is a certain percentage of the fair market value that is determined by local assessors to be the total taxable value of land and additions on the property. | Land | Improvement |
|---|---|---|---|---|
| 2025 | $2,940 | $104,520 | $10,000 | $94,520 |
| 2024 | $3,256 | $100,880 | $10,000 | $90,880 |
| 2023 | $2,870 | $88,440 | $14,000 | $74,440 |
| 2022 | $1,874 | $83,520 | $14,000 | $69,520 |
| 2021 | $1,675 | $74,440 | $14,000 | $60,440 |
| 2020 | $1,647 | $72,880 | $14,000 | $58,880 |
| 2019 | $1,647 | $72,880 | $14,000 | $58,880 |
| 2018 | $1,647 | $72,880 | $14,000 | $58,880 |
| 2017 | $1,648 | $72,880 | $14,000 | $58,880 |
| 2016 | $1,651 | $72,880 | $14,000 | $58,880 |
| 2015 | -- | $72,880 | $14,000 | $58,880 |
| 2014 | -- | $72,880 | $14,000 | $58,880 |
| 2013 | -- | $72,880 | $14,000 | $58,880 |
Source: Public Records
Map
Nearby Homes
- 104 Downshire Way
- 221 Loudon Hill Dr
- 106 Vinings Place Dr
- 113 Erin Way
- 2920 U S 41
- 106 Lisa Marie Ct
- 116 Sasanqua Dr
- 408 Nandina Ct
- 124 Flora Cir
- 158 Holly Pointe
- 120 Legacy Ct
- 107 Bellshill Ct
- 112 Legacy Ct
- 468 Nandina Ct
- 536 Childers Dr
- 105 Welney Cir
- 124 Cedarland Dr
- 214 Cheshire Dr
- 201 Running Creek Dr
- 121 Bridgeway Dr
- 101 Trickum Ct
- 97 Trickum Ct
- 111 Downshire Way
- 109 Downshire Way
- 113 Downshire Way
- 103 Trickum Ct
- 102 Trickum Ct
- 104 Trickum Ct
- 107 Downshire Way Unit 18
- 107 Downshire Way
- 100 Trickum Ct
- 205 Flagler Way
- 105 Trickum Ct
- 105 Trickum Ct Unit 10
- 207 Flagler Way
- 203 Flagler Way
- 105 Downshire Way
- 106 Trickum Ct
- 201 Flagler Way
- 112 Downshire Way
Your Personal Tour Guide
Ask me questions while you tour the home.