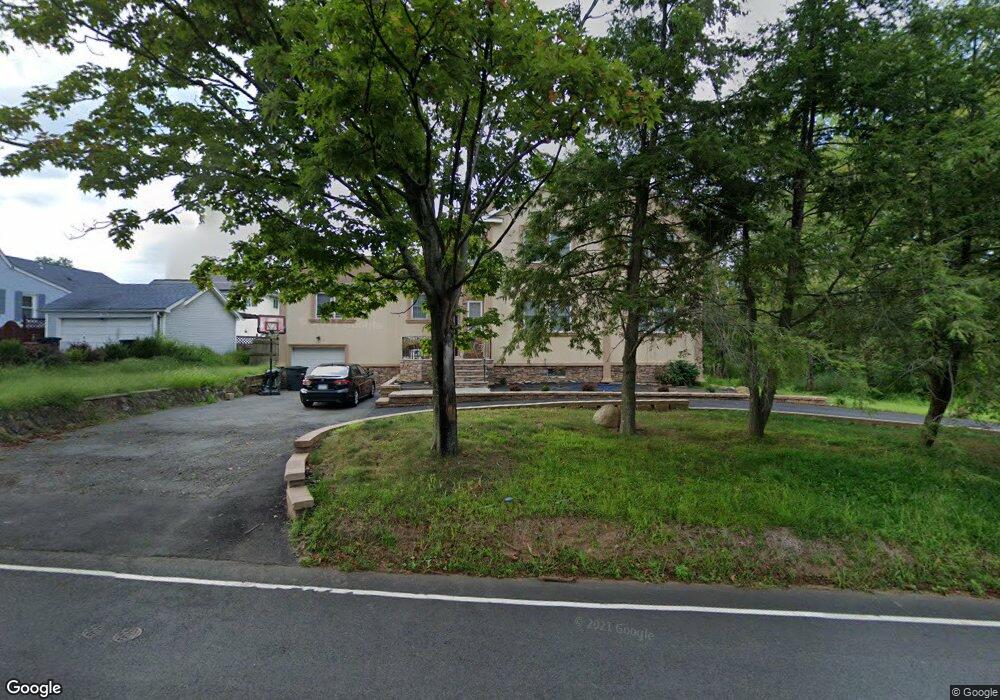
99 Troy Rd East Hanover, NJ 07936
Estimated Value: $723,000 - $1,080,000
--
Bed
--
Bath
3,702
Sq Ft
$244/Sq Ft
Est. Value
About This Home
This home is located at 99 Troy Rd, East Hanover, NJ 07936 and is currently estimated at $903,609, approximately $244 per square foot. 99 Troy Rd is a home located in Morris County with nearby schools including Frank J. Smith Elementary School, Central Elementary School, and East Hanover Middle School.
Ownership History
Date
Name
Owned For
Owner Type
Purchase Details
Closed on
May 2, 2014
Sold by
Nisbet George T and Nisbet Linda M
Bought by
Mokhemar Mohammed and Mokhemar Shatha
Current Estimated Value
Purchase Details
Closed on
Jun 30, 1999
Sold by
Gajewski Edward and Gajewski Wladyslawa
Bought by
Nisbet George T and Lepore Linda M
Home Financials for this Owner
Home Financials are based on the most recent Mortgage that was taken out on this home.
Original Mortgage
$207,000
Interest Rate
7.39%
Mortgage Type
Purchase Money Mortgage
Create a Home Valuation Report for This Property
The Home Valuation Report is an in-depth analysis detailing your home's value as well as a comparison with similar homes in the area
Home Values in the Area
Average Home Value in this Area
Purchase History
| Date | Buyer | Sale Price | Title Company |
|---|---|---|---|
| Mokhemar Mohammed | $378,000 | -- | |
| Nisbet George T | $230,000 | Chicago Title Insurance Co |
Source: Public Records
Mortgage History
| Date | Status | Borrower | Loan Amount |
|---|---|---|---|
| Previous Owner | Nisbet George T | $207,000 |
Source: Public Records
Tax History Compared to Growth
Tax History
| Year | Tax Paid | Tax Assessment Tax Assessment Total Assessment is a certain percentage of the fair market value that is determined by local assessors to be the total taxable value of land and additions on the property. | Land | Improvement |
|---|---|---|---|---|
| 2025 | $9,229 | $355,800 | $152,200 | $203,600 |
| 2024 | $8,877 | $355,800 | $152,200 | $203,600 |
| 2023 | $8,877 | $355,800 | $152,200 | $203,600 |
| 2022 | $8,674 | $355,800 | $152,200 | $203,600 |
| 2021 | $8,674 | $355,800 | $152,200 | $203,600 |
| 2020 | $8,504 | $355,800 | $152,200 | $203,600 |
| 2019 | $8,347 | $355,800 | $152,200 | $203,600 |
| 2018 | $6,190 | $272,100 | $152,200 | $119,900 |
| 2017 | $5,989 | $272,100 | $152,200 | $119,900 |
| 2016 | $5,907 | $272,100 | $152,200 | $119,900 |
| 2015 | $5,823 | $272,100 | $152,200 | $119,900 |
| 2014 | $5,698 | $272,100 | $152,200 | $119,900 |
Source: Public Records
Map
Nearby Homes
- 21 Weaver Place
- 19 Petry Dr
- 54 Grove Ave
- 59 Grove Ave
- 4 Eastwood Terrace
- 40 Grant Ave
- 48 Grant Ave
- 4 Justin Dr
- 63 Grant Ave
- 68 Eastwood Terrace
- 62 Eastwood Terrace
- Birch Plan at Valley View Park - The Signature Collection
- Pershing Plan at Valley View Park - The Pershing Collection
- Monterey Plan at Valley View Park - The Monterey Collection
- Maple Plan at Valley View Park - The Signature Collection
- 65 Eastwood Terrace
- 67 Eastwood Terrace
- 69 Eastwood Terrace
- 46 Eastwood Terrace Unit 55
- 7 Eastwood Terrace