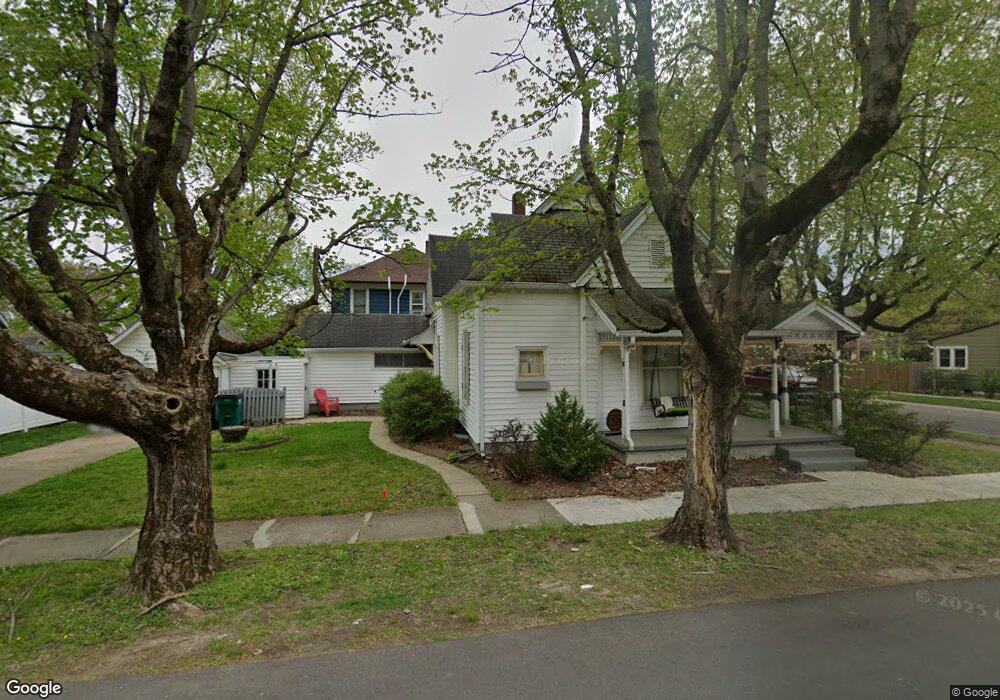
99 W Adams St Franklin, IN 46131
Estimated Value: $103,000 - $194,000
2
Beds
1
Bath
973
Sq Ft
$163/Sq Ft
Est. Value
About This Home
This home is located at 99 W Adams St, Franklin, IN 46131 and is currently estimated at $159,037, approximately $163 per square foot. 99 W Adams St is a home located in Johnson County with nearby schools including Northwood Elementary School, Franklin Community Middle School, and Custer Baker Intermediate School.
Ownership History
Date
Name
Owned For
Owner Type
Purchase Details
Closed on
Jun 7, 2012
Sold by
Fannie Mae
Bought by
Heavilin Douglas W and Heavilin Amy L
Current Estimated Value
Purchase Details
Closed on
Mar 15, 2012
Sold by
Moon Judy I and Nationstar Mortgage Llc
Bought by
Fannie Mae and Federal National Mortgage Association
Purchase Details
Closed on
Dec 16, 2005
Sold by
Olson Earl N and Olson Barbara J
Bought by
Moon Judy I
Home Financials for this Owner
Home Financials are based on the most recent Mortgage that was taken out on this home.
Original Mortgage
$76,000
Interest Rate
6.48%
Mortgage Type
New Conventional
Purchase Details
Closed on
Aug 26, 2005
Sold by
Olsen Joseph
Bought by
Olson Earl N and Olson Barbara J
Purchase Details
Closed on
Apr 18, 2005
Sold by
Olson Earl N and Olson Barbara J
Bought by
Olson Joseph
Home Financials for this Owner
Home Financials are based on the most recent Mortgage that was taken out on this home.
Original Mortgage
$61,600
Interest Rate
6.06%
Mortgage Type
New Conventional
Create a Home Valuation Report for This Property
The Home Valuation Report is an in-depth analysis detailing your home's value as well as a comparison with similar homes in the area
Home Values in the Area
Average Home Value in this Area
Purchase History
| Date | Buyer | Sale Price | Title Company |
|---|---|---|---|
| Heavilin Douglas W | -- | None Available | |
| Fannie Mae | $70,340 | None Available | |
| Moon Judy I | -- | Chicago Title Ins Co | |
| Olson Earl N | -- | None Available | |
| Olson Joseph | -- | Chicago Title Ins Co |
Source: Public Records
Mortgage History
| Date | Status | Borrower | Loan Amount |
|---|---|---|---|
| Previous Owner | Moon Judy I | $76,000 | |
| Previous Owner | Olson Joseph | $61,600 |
Source: Public Records
Tax History Compared to Growth
Tax History
| Year | Tax Paid | Tax Assessment Tax Assessment Total Assessment is a certain percentage of the fair market value that is determined by local assessors to be the total taxable value of land and additions on the property. | Land | Improvement |
|---|---|---|---|---|
| 2025 | $2,343 | $98,700 | $15,800 | $82,900 |
| 2024 | $2,343 | $105,800 | $15,800 | $90,000 |
| 2023 | $2,166 | $97,200 | $15,800 | $81,400 |
| 2022 | $1,991 | $89,100 | $15,800 | $73,300 |
| 2021 | $1,689 | $75,500 | $14,800 | $60,700 |
| 2020 | $1,780 | $79,600 | $14,800 | $64,800 |
| 2019 | $1,693 | $75,700 | $9,500 | $66,200 |
| 2018 | $1,347 | $68,900 | $9,500 | $59,400 |
| 2017 | $1,311 | $65,300 | $9,500 | $55,800 |
| 2016 | $1,227 | $61,900 | $9,500 | $52,400 |
| 2014 | $1,147 | $57,100 | $15,700 | $41,400 |
| 2013 | $1,147 | $55,400 | $15,800 | $39,600 |
Source: Public Records
Map
Nearby Homes
- 298 N Water St
- 0 W 900 Hwy Unit 202537998
- 147 E King St
- 199 Walnut St
- 751 Graham St
- 178 S Water St Unit F
- 76 E Wayne St Unit B
- 348 Ohio St
- 252 S Main St
- 698 Yandes St
- 351 Cincinnati St
- 750 Hurricane St
- 651 Hamilton Ave
- 998 E King St
- 123 14th St
- 1110 Hillview Dr
- 1121 E Adams Dr
- 772 Franklin Lakes Blvd
- 1624 Roberts Rd
- 785 Shoreline Ct
- 269 N Jackson St
- 251 N Jackson St
- 39 W Adams St
- 298 N Jackson St
- 100 W Adams St
- 249 N Jackson St
- 98 W Adams St
- 96 W Adams St
- 119 W Adams St
- 120 W Adams St
- 250 N Main St
- 116 W Adams St
- 278 N Main St
- 278 N Main St Unit B
- 125 W Adams St
- 50 W King St
- 40 W Adams St
- 298 N Main St
- 98 W King St
- 137 W Adams St