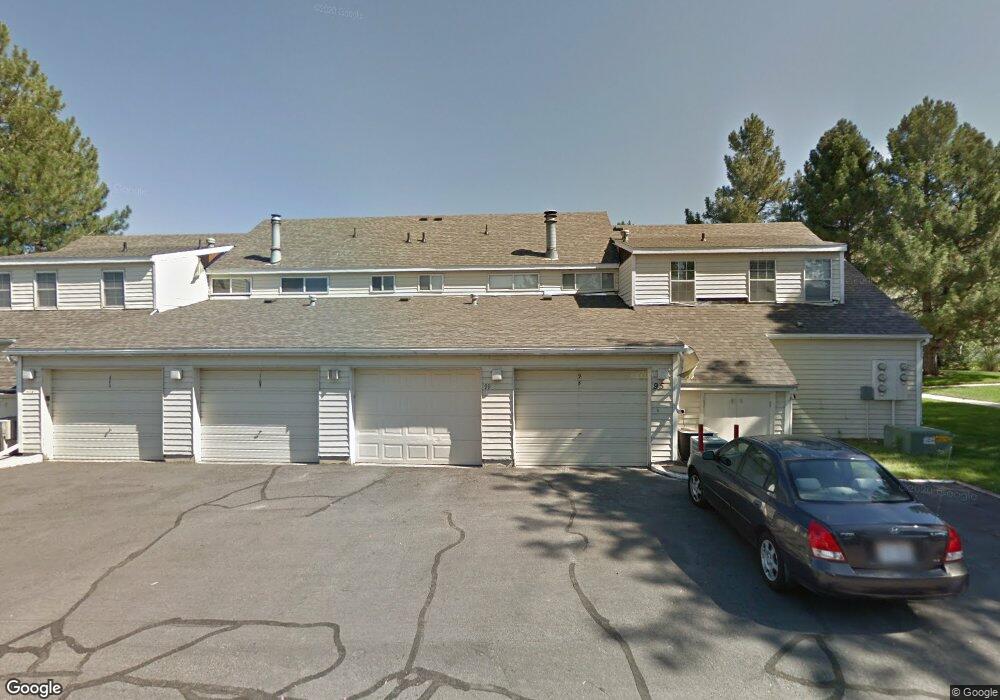
99 W Pheasantbrook Dr Centerville, UT 84014
Estimated Value: $362,000 - $388,000
3
Beds
2
Baths
1,314
Sq Ft
$281/Sq Ft
Est. Value
About This Home
This home is located at 99 W Pheasantbrook Dr, Centerville, UT 84014 and is currently estimated at $369,680, approximately $281 per square foot. 99 W Pheasantbrook Dr is a home located in Davis County with nearby schools including Stewart Elementary School, Centerville Jr High, and Viewmont High School.
Ownership History
Date
Name
Owned For
Owner Type
Purchase Details
Closed on
Mar 27, 2013
Sold by
Esposito Regina
Bought by
Fernelius Cason
Current Estimated Value
Home Financials for this Owner
Home Financials are based on the most recent Mortgage that was taken out on this home.
Original Mortgage
$5,500
Outstanding Balance
$3,872
Interest Rate
3.49%
Mortgage Type
New Conventional
Estimated Equity
$365,808
Purchase Details
Closed on
Dec 10, 2004
Sold by
Hoffenbeck Regina and Esposito Regina
Bought by
Esposito Regina
Home Financials for this Owner
Home Financials are based on the most recent Mortgage that was taken out on this home.
Original Mortgage
$122,726
Interest Rate
5.7%
Mortgage Type
VA
Purchase Details
Closed on
Jul 16, 2002
Sold by
Snell J Darwin and Snell Patsy H
Bought by
Hoffenbeck Regina
Home Financials for this Owner
Home Financials are based on the most recent Mortgage that was taken out on this home.
Original Mortgage
$122,187
Interest Rate
6.69%
Mortgage Type
VA
Create a Home Valuation Report for This Property
The Home Valuation Report is an in-depth analysis detailing your home's value as well as a comparison with similar homes in the area
Purchase History
| Date | Buyer | Sale Price | Title Company |
|---|---|---|---|
| Fernelius Cason | -- | Backman Title Servic | |
| Esposito Regina | -- | Surety Title Agency | |
| Hoffenbeck Regina | -- | Equity Title Agency |
Source: Public Records
Mortgage History
| Date | Status | Borrower | Loan Amount |
|---|---|---|---|
| Open | Fernelius Cason | $5,500 | |
| Previous Owner | Esposito Regina | $122,726 | |
| Previous Owner | Hoffenbeck Regina | $122,187 |
Source: Public Records
Tax History
| Year | Tax Paid | Tax Assessment Tax Assessment Total Assessment is a certain percentage of the fair market value that is determined by local assessors to be the total taxable value of land and additions on the property. | Land | Improvement |
|---|---|---|---|---|
| 2025 | $1,874 | $179,300 | $72,050 | $107,250 |
| 2024 | $1,820 | $177,100 | $55,000 | $122,100 |
| 2023 | $1,803 | $317,000 | $98,000 | $219,000 |
| 2022 | $1,824 | $176,550 | $52,800 | $123,750 |
| 2021 | $1,519 | $229,000 | $69,000 | $160,000 |
| 2020 | $1,347 | $203,000 | $64,500 | $138,500 |
| 2019 | $1,324 | $195,000 | $62,000 | $133,000 |
| 2018 | $1,189 | $173,000 | $58,000 | $115,000 |
| 2016 | $916 | $74,030 | $15,400 | $58,630 |
| 2015 | $954 | $72,765 | $15,400 | $57,365 |
| 2014 | $939 | $73,287 | $18,333 | $54,954 |
| 2013 | -- | $78,893 | $17,875 | $61,018 |
Source: Public Records
Map
Nearby Homes
- 775 Pheasantbrook Cir
- 66 Brookside Ln
- 165 W Pheasantbrook Dr
- 781 Pheasantbrook Dr
- 281 W 650 N Unit B
- 282 W 605 N Unit A
- 282 W 605 N Unit I
- 303 W 650 N Unit I
- 271 Brookfield Ln
- 243 Balsam Dr
- 563 N 220 E
- 371 W 1125 N
- 493 W 620 N Unit 122
- 507 W 620 N
- 1238 N 450 W
- 56 W 200 N
- 132 W 200 N
- 638 N 800 W
- 984 N 500 E
- 185 N 50 W
- 95 W Pheasantbrook Dr
- 111 W Pheasantbrook Dr
- 821 Lakeside Ln
- 89 W Pheasantbrook Dr
- 829 Lakeside Ln
- 833 Lakeside Ln
- 122 W Pheasantbrook Dr
- 837 Lakeside Ln
- 126 W Pheasantbrook Dr
- 61 W Pheasantbrook Dr
- 121 Lakeside Ln
- 108 W 710 N
- 98 W 710 N
- 118 W 710 N
- 78 Brookside Ln
- 130 W Pheasantbrook Dr
- 127 Lakeside Ln
- 88 W 710 N
- 72 Brookside Ln
- 131 N Lakeside Ln
Your Personal Tour Guide
Ask me questions while you tour the home.