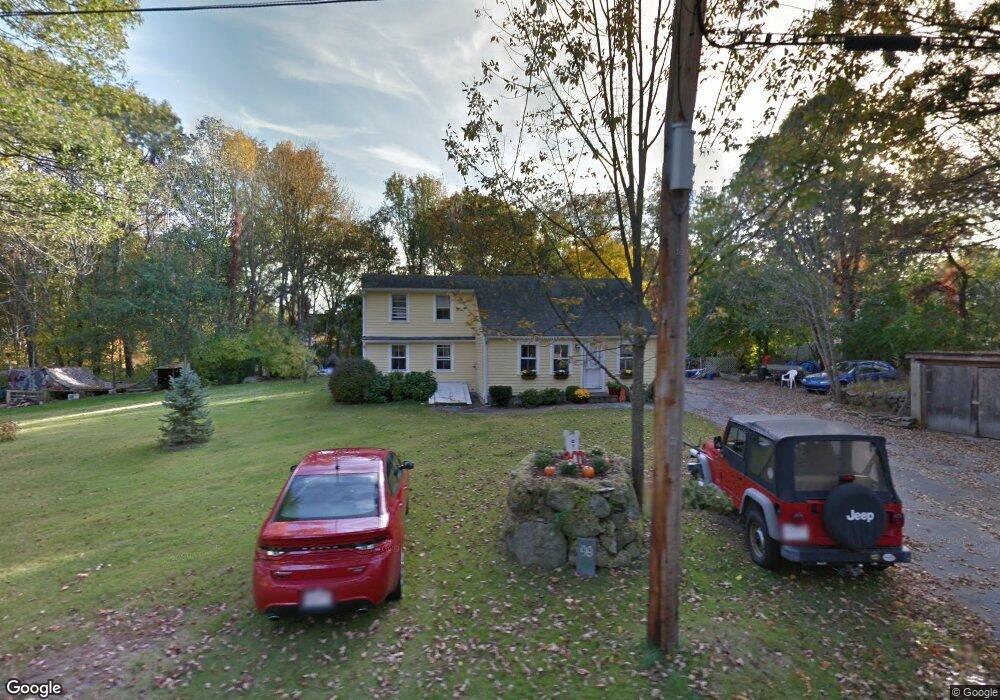
99 West St Medway, MA 02053
Estimated Value: $486,000 - $556,000
3
Beds
1
Bath
1,451
Sq Ft
$358/Sq Ft
Est. Value
About This Home
This home is located at 99 West St, Medway, MA 02053 and is currently estimated at $519,226, approximately $357 per square foot. 99 West St is a home located in Norfolk County with nearby schools including John D. McGovern Elementary School, Burke-Memorial Elementary, and Medway Middle School.
Ownership History
Date
Name
Owned For
Owner Type
Purchase Details
Closed on
Jan 15, 2003
Sold by
Burnett Virginia R
Bought by
Oneill Daniel and Oneill Wendy L
Current Estimated Value
Home Financials for this Owner
Home Financials are based on the most recent Mortgage that was taken out on this home.
Original Mortgage
$155,200
Outstanding Balance
$66,981
Interest Rate
6.18%
Mortgage Type
Purchase Money Mortgage
Estimated Equity
$452,245
Create a Home Valuation Report for This Property
The Home Valuation Report is an in-depth analysis detailing your home's value as well as a comparison with similar homes in the area
Home Values in the Area
Average Home Value in this Area
Purchase History
| Date | Buyer | Sale Price | Title Company |
|---|---|---|---|
| Oneill Daniel | $194,000 | -- |
Source: Public Records
Mortgage History
| Date | Status | Borrower | Loan Amount |
|---|---|---|---|
| Open | Oneill Daniel | $155,200 |
Source: Public Records
Tax History Compared to Growth
Tax History
| Year | Tax Paid | Tax Assessment Tax Assessment Total Assessment is a certain percentage of the fair market value that is determined by local assessors to be the total taxable value of land and additions on the property. | Land | Improvement |
|---|---|---|---|---|
| 2025 | $6,346 | $445,300 | $271,400 | $173,900 |
| 2024 | $6,412 | $445,300 | $271,400 | $173,900 |
| 2023 | $6,218 | $390,100 | $233,900 | $156,200 |
| 2022 | $6,203 | $366,400 | $208,800 | $157,600 |
| 2021 | $5,692 | $326,000 | $187,900 | $138,100 |
| 2020 | $5,296 | $302,600 | $167,000 | $135,600 |
| 2019 | $5,419 | $319,300 | $183,700 | $135,600 |
| 2018 | $5,174 | $293,000 | $158,700 | $134,300 |
| 2017 | $5,184 | $289,300 | $158,700 | $130,600 |
| 2016 | $4,906 | $270,900 | $140,300 | $130,600 |
| 2015 | $4,576 | $250,900 | $125,300 | $125,600 |
| 2014 | $4,589 | $243,600 | $133,600 | $110,000 |
Source: Public Records
Map
Nearby Homes
- 22 Granite St
- 6 Rainbow Dr
- 9 Tulip Way
- 4 Deerfield Rd
- 78 Fisher St
- 85 Fisher St
- 39 West St
- 0 Old Log Lane (Farm St) Unit 73416329
- 462 Hartford Ave
- 455 Hartford Ave
- 387 Hartford Ave
- 6 Freedom Trail
- 48 Black Bear Cir Unit 48
- 11 Black Bear Unit 11
- 43 Black Bear Cir Unit 43
- 5 Fales St
- 9 Black Bear Cir Unit 9
- 7 Black Bear Unit 7
- 3 Black Bear Cir Unit 3
- 10 Black Bear Unit 10