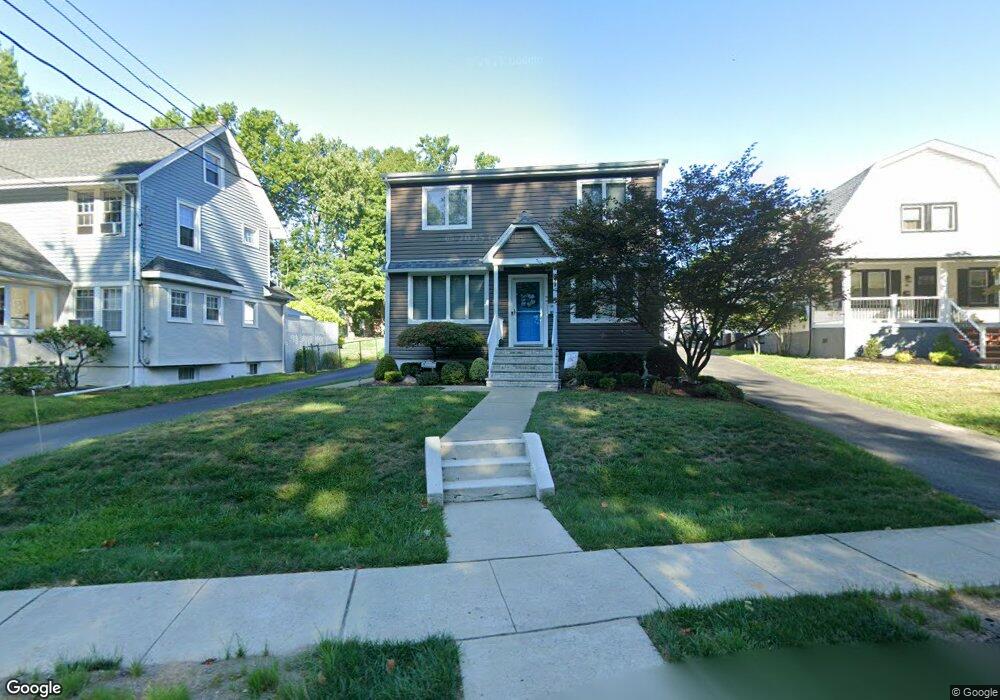
99 Wilmore Rd Little Falls, NJ 07424
Estimated Value: $609,955 - $796,000
--
Bed
--
Bath
1,692
Sq Ft
$412/Sq Ft
Est. Value
About This Home
This home is located at 99 Wilmore Rd, Little Falls, NJ 07424 and is currently estimated at $697,239, approximately $412 per square foot. 99 Wilmore Rd is a home located in Passaic County with nearby schools including Little Falls Township Public School No. 2, Little Falls School No. 3, and Little Falls School No. 1.
Ownership History
Date
Name
Owned For
Owner Type
Purchase Details
Closed on
Jun 2, 1995
Sold by
Tepe David
Bought by
Black Robert and Black Susan
Current Estimated Value
Home Financials for this Owner
Home Financials are based on the most recent Mortgage that was taken out on this home.
Original Mortgage
$155,000
Interest Rate
7.7%
Purchase Details
Closed on
Feb 21, 1995
Sold by
Kufta Eleanor
Bought by
Tepe David
Home Financials for this Owner
Home Financials are based on the most recent Mortgage that was taken out on this home.
Original Mortgage
$108,000
Interest Rate
8.89%
Create a Home Valuation Report for This Property
The Home Valuation Report is an in-depth analysis detailing your home's value as well as a comparison with similar homes in the area
Home Values in the Area
Average Home Value in this Area
Purchase History
| Date | Buyer | Sale Price | Title Company |
|---|---|---|---|
| Black Robert | $195,000 | -- | |
| Tepe David | $135,000 | -- |
Source: Public Records
Mortgage History
| Date | Status | Borrower | Loan Amount |
|---|---|---|---|
| Closed | Black Robert | $155,000 | |
| Previous Owner | Tepe David | $108,000 |
Source: Public Records
Tax History Compared to Growth
Tax History
| Year | Tax Paid | Tax Assessment Tax Assessment Total Assessment is a certain percentage of the fair market value that is determined by local assessors to be the total taxable value of land and additions on the property. | Land | Improvement |
|---|---|---|---|---|
| 2025 | $11,139 | $334,300 | $167,300 | $167,000 |
| 2024 | $10,972 | $334,300 | $167,300 | $167,000 |
| 2022 | $10,985 | $334,300 | $167,300 | $167,000 |
| 2021 | $10,738 | $334,300 | $167,300 | $167,000 |
| 2020 | $10,641 | $334,300 | $167,300 | $167,000 |
| 2019 | $10,634 | $334,300 | $167,300 | $167,000 |
| 2018 | $10,564 | $334,300 | $167,300 | $167,000 |
| 2017 | $10,574 | $334,300 | $167,300 | $167,000 |
| 2016 | $10,434 | $334,300 | $167,300 | $167,000 |
| 2015 | $10,283 | $334,300 | $167,300 | $167,000 |
| 2014 | $10,009 | $334,300 | $167,300 | $167,000 |
Source: Public Records
Map
Nearby Homes