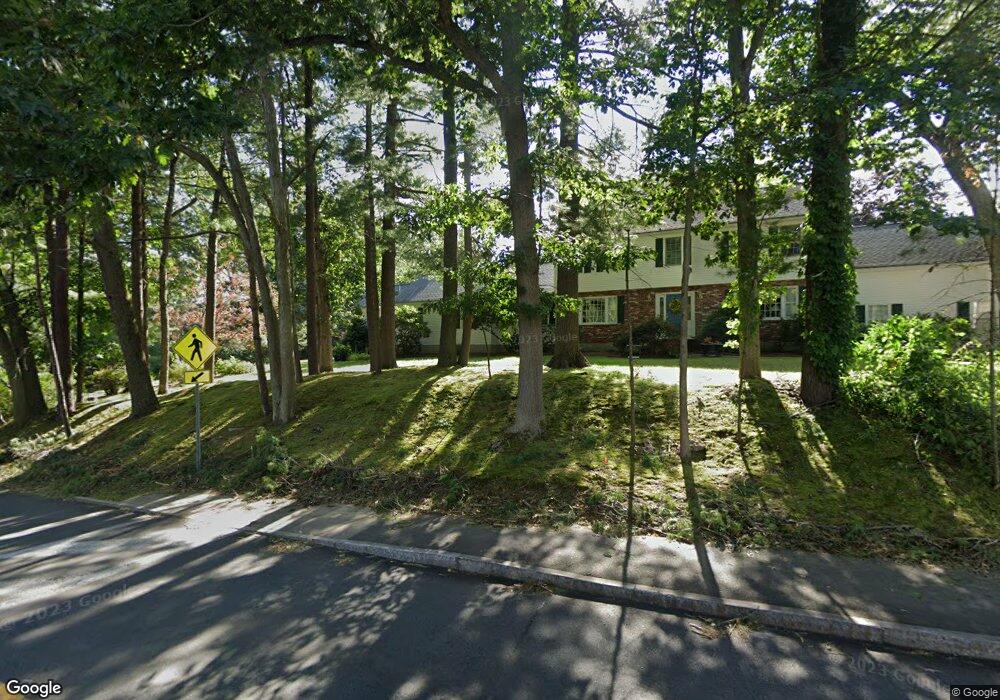
99 Woburn St Andover, MA 01810
Estimated Value: $1,362,101 - $1,498,000
About This Home
This home is located at 99 Woburn St, Andover, MA 01810 and is currently estimated at $1,416,025, approximately $347 per square foot. 99 Woburn St is a home located in Essex County with nearby schools including South Elementary School, Doherty Middle School, and Andover High School.
Ownership History
We collect this data history from publicly available records. To have your information removed, we recommend requesting removal directly through your county’s website.
Purchase Details
Purchase Details
Purchase Details
Purchase History
We collect this data history from publicly available records. To have your information removed, we recommend requesting removal directly through your county’s website.
| Date | Buyer | Sale Price | Title Company |
|---|---|---|---|
| -- | None Available | ||
| -- | None Available | ||
| -- | -- | ||
| -- | -- | ||
| -- | -- | ||
| $142,400 | -- |
Mortgage History
We collect this data history from publicly available records. To have your information removed, we recommend requesting removal directly through your county’s website.
| Date | Status | Borrower | Loan Amount |
|---|---|---|---|
| Previous Owner | $100,000 |
Tax History
We collect this data history from publicly available records. To have your information removed, we recommend requesting removal directly through your county’s website.
| Year | Tax Paid | Tax Assessment Tax Assessment Total Assessment is a certain percentage of the fair market value that is determined by local assessors to be the total taxable value of land and additions on the property. | Land | Improvement |
|---|---|---|---|---|
| 2025 | $13,976 | $1,119,000 | $414,800 | $704,200 |
| 2024 | $13,453 | $1,044,500 | $402,900 | $641,600 |
| 2023 | $12,870 | $942,200 | $363,000 | $579,200 |
| 2022 | $12,171 | $833,600 | $315,600 | $518,000 |
| 2021 | $11,692 | $764,700 | $286,800 | $477,900 |
| 2020 | $11,247 | $749,300 | $279,700 | $469,600 |
| 2019 | $11,210 | $734,100 | $271,400 | $462,700 |
| 2018 | $10,768 | $688,500 | $261,100 | $427,400 |
| 2017 | $10,356 | $682,200 | $256,000 | $426,200 |
| 2016 | $10,149 | $684,800 | $256,000 | $428,800 |
| 2015 | $9,765 | $652,300 | $246,100 | $406,200 |
Map
- 5 Powers Rd
- 5 Hillcrest Rd
- 9 River Park Terrace
- 19 Tilton Ln
- 32 River St
- 232 Andover St
- 3 Regency Ridge
- 10 Hawk Ridge Rd
- 99 Sunset Rock Rd
- 18 Dale St Unit 9D
- 56 Sunset Rock Rd
- 7 Cider Hill Way
- 28 Ballardvale Rd
- 75 Spring Grove Rd
- 14 Ballardvale Rd
- 13 Pinecrest Rd
- 9 Fiorenza Dr
- 5 Courtney Ln
- 340 S Main St
- 139 Hidden Rd
Ask me questions while you tour the home.