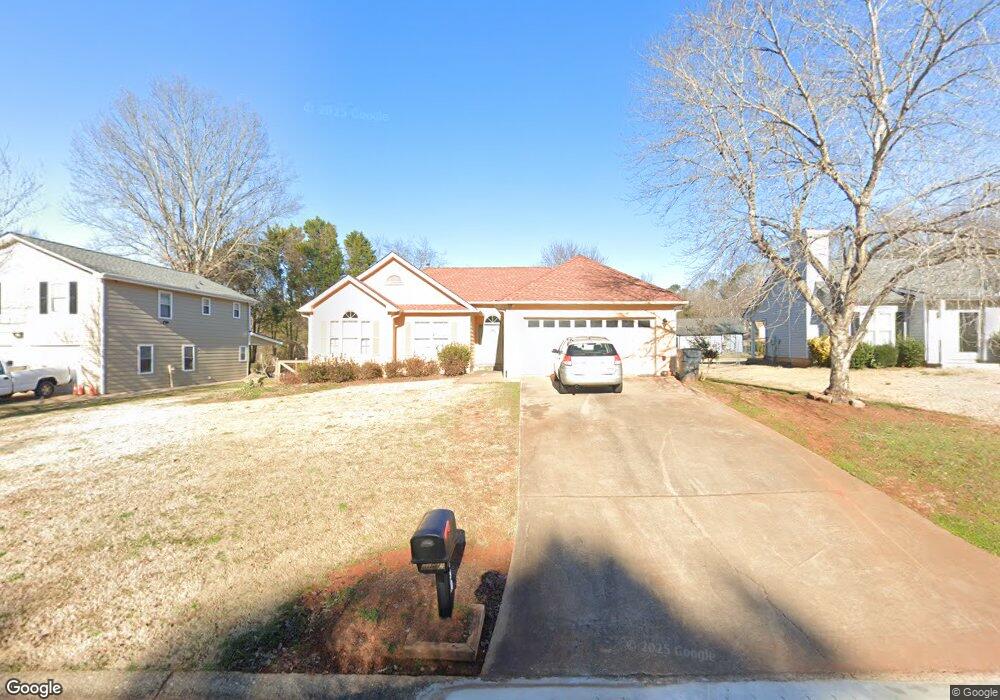
990 Appian Way Unit 3 Lawrenceville, GA 30046
Estimated Value: $310,000 - $349,000
4
Beds
2
Baths
1,555
Sq Ft
$212/Sq Ft
Est. Value
About This Home
This home is located at 990 Appian Way Unit 3, Lawrenceville, GA 30046 and is currently estimated at $329,549, approximately $211 per square foot. 990 Appian Way Unit 3 is a home located in Gwinnett County with nearby schools including Benefield Elementary School, Richards Middle School, and Discovery High School.
Ownership History
Date
Name
Owned For
Owner Type
Purchase Details
Closed on
May 24, 2004
Sold by
Hernandez Martin
Bought by
Hernandez-Flores Elsa M
Current Estimated Value
Home Financials for this Owner
Home Financials are based on the most recent Mortgage that was taken out on this home.
Original Mortgage
$107,100
Outstanding Balance
$51,172
Interest Rate
5.88%
Mortgage Type
New Conventional
Estimated Equity
$278,377
Purchase Details
Closed on
Aug 16, 2001
Sold by
Marrs Matthew J and Marrs Graham J
Bought by
Hernandez Martin
Home Financials for this Owner
Home Financials are based on the most recent Mortgage that was taken out on this home.
Original Mortgage
$119,300
Interest Rate
7.08%
Mortgage Type
New Conventional
Purchase Details
Closed on
Jun 6, 2000
Sold by
Marrs Deborah S
Bought by
Marrs Matthew J
Purchase Details
Closed on
Nov 27, 1995
Sold by
Crowder Harrison Margaret
Bought by
Marrs Matthew Deborah and Marrs Graham
Create a Home Valuation Report for This Property
The Home Valuation Report is an in-depth analysis detailing your home's value as well as a comparison with similar homes in the area
Home Values in the Area
Average Home Value in this Area
Purchase History
| Date | Buyer | Sale Price | Title Company |
|---|---|---|---|
| Hernandez-Flores Elsa M | $119,000 | -- | |
| Hernandez Martin | $123,000 | -- | |
| Marrs Matthew J | -- | -- | |
| Marrs Matthew Deborah | $93,500 | -- |
Source: Public Records
Mortgage History
| Date | Status | Borrower | Loan Amount |
|---|---|---|---|
| Open | Hernandez-Flores Elsa M | $107,100 | |
| Previous Owner | Hernandez Martin | $119,300 | |
| Closed | Marrs Matthew Deborah | $0 |
Source: Public Records
Tax History Compared to Growth
Tax History
| Year | Tax Paid | Tax Assessment Tax Assessment Total Assessment is a certain percentage of the fair market value that is determined by local assessors to be the total taxable value of land and additions on the property. | Land | Improvement |
|---|---|---|---|---|
| 2025 | $4,667 | $122,160 | $21,600 | $100,560 |
| 2024 | $4,505 | $116,240 | $21,600 | $94,640 |
| 2023 | $4,505 | $116,640 | $20,800 | $95,840 |
| 2022 | $3,819 | $97,920 | $20,800 | $77,120 |
| 2021 | $3,347 | $83,520 | $16,800 | $66,720 |
| 2020 | $3,027 | $74,200 | $14,400 | $59,800 |
| 2019 | $2,498 | $66,000 | $14,400 | $51,600 |
| 2018 | $2,498 | $62,240 | $12,080 | $50,160 |
| 2016 | $2,121 | $50,960 | $10,000 | $40,960 |
| 2015 | $1,616 | $36,120 | $7,200 | $28,920 |
| 2014 | $1,412 | $36,120 | $7,200 | $28,920 |
Source: Public Records
Map
Nearby Homes
- 921 Appian Way Unit 3
- 440 Sterling Hill Dr
- 912 Noble Oak Ct
- 1350 Lawrenceville Hwy
- 1330 Lawrenceville Hwy
- 1469 Bridgestone Dr
- 1102 Noble Oak Ct
- 1384 Sunrise Way
- 493 Tracy Ct
- 474 Daisy Trail
- 457 Casey Ct
- 398 Parc River Blvd
- 1050 Dogwood Park Dr
- 1522 Parc Main St
- 255 Carriage Station Dr
- 1634 Lamancha Dr
- 925 Dogwood Park Dr
- 1165 Johnson Cir
- 1222 Grayland Ln
- 4575 Windale Dr
- 980 Appian Way Unit 3
- 1000 Appian Way
- 1230 Alexander Ct Unit 3
- 1010 Appian Way
- 970 Appian Way
- 1240 Alexander Ct
- 991 Appian Way
- 1210 Alexander Ct
- 1001 Appian Way Unit 3
- 981 Appian Way Unit 3
- 1011 Appian Way
- 1020 Appian Way
- 971 Appian Way
- 900 Appian Way
- 890 Appian Way Unit 3
- 1241 Alexander Ct
- 910 Appian Way Unit 3
- 1021 Appian Way Unit 3
- 880 Appian Way Unit 2
- 1200 Alexander Ct Unit 3