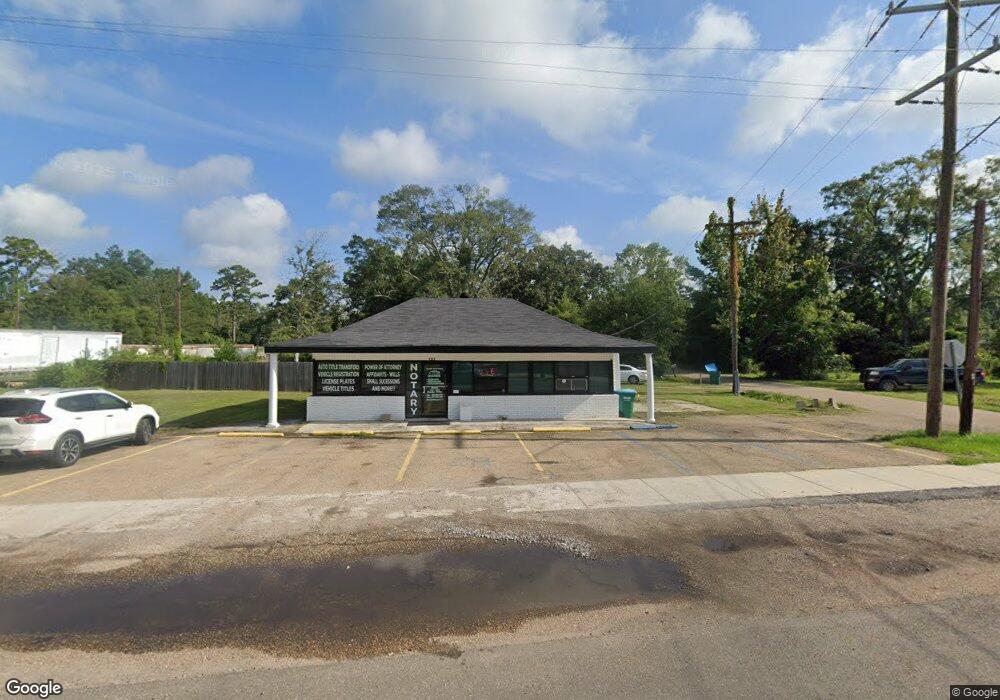
990 E Pine St Ponchatoula, LA 70454
Estimated Value: $198,000
Studio
--
Bath
900
Sq Ft
$220/Sq Ft
Est. Value
About This Home
This home is located at 990 E Pine St, Ponchatoula, LA 70454 and is currently estimated at $198,000, approximately $220 per square foot. 990 E Pine St is a home located in Tangipahoa Parish with nearby schools including Perrin Early Learning Center, Tucker Memorial Elementary School, and D.C. Reeves Elementary School.
Ownership History
Date
Name
Owned For
Owner Type
Purchase Details
Closed on
Feb 11, 2025
Sold by
Bishop Cage and Bishop William Cage
Bought by
J Allen Investments Llc
Current Estimated Value
Home Financials for this Owner
Home Financials are based on the most recent Mortgage that was taken out on this home.
Original Mortgage
$174,559
Outstanding Balance
$172,755
Interest Rate
6.91%
Mortgage Type
New Conventional
Estimated Equity
$25,245
Purchase Details
Closed on
Dec 14, 2021
Sold by
J Allen Investments Llc
Bought by
Cage Bishop
Home Financials for this Owner
Home Financials are based on the most recent Mortgage that was taken out on this home.
Original Mortgage
$180,000
Interest Rate
3.09%
Mortgage Type
Construction
Create a Home Valuation Report for This Property
The Home Valuation Report is an in-depth analysis detailing your home's value as well as a comparison with similar homes in the area
Home Values in the Area
Average Home Value in this Area
Purchase History
| Date | Buyer | Sale Price | Title Company |
|---|---|---|---|
| J Allen Investments Llc | $12,000 | None Listed On Document | |
| J Allen Investments Llc | $12,000 | None Listed On Document | |
| Cage Bishop | -- | New Title Company Name | |
| J Allen Investments Llc | $180,000 | New Title Company Name | |
| J Allen Investments Llc | $180,000 | New Title Company Name |
Source: Public Records
Mortgage History
| Date | Status | Borrower | Loan Amount |
|---|---|---|---|
| Open | J Allen Investments Llc | $174,559 | |
| Closed | J Allen Investments Llc | $174,559 | |
| Previous Owner | J Allen Investments Llc | $180,000 |
Source: Public Records
Tax History
| Year | Tax Paid | Tax Assessment Tax Assessment Total Assessment is a certain percentage of the fair market value that is determined by local assessors to be the total taxable value of land and additions on the property. | Land | Improvement |
|---|---|---|---|---|
| 2025 | $1,125 | $16,254 | $3,240 | $13,014 |
| 2024 | $1,108 | $16,254 | $3,240 | $13,014 |
| 2023 | $1,114 | $16,014 | $3,000 | $13,014 |
| 2022 | $1,114 | $16,014 | $3,000 | $13,014 |
| 2021 | $548 | $6,304 | $3,000 | $3,304 |
| 2020 | $542 | $6,304 | $3,000 | $3,304 |
| 2019 | $541 | $6,304 | $3,000 | $3,304 |
| 2018 | $543 | $6,304 | $3,000 | $3,304 |
| 2017 | $672 | $7,804 | $4,500 | $3,304 |
| 2016 | $672 | $7,804 | $4,500 | $3,304 |
| 2015 | $544 | $7,804 | $4,500 | $3,304 |
| 2014 | $497 | $7,804 | $4,500 | $3,304 |
Source: Public Records
Map
Nearby Homes
- 800 E Pine St
- 788 E Pine St
- 18270 Highway 22 Unit LOT 26
- 18369 Louisiana 22
- 18369 Hwy 22 None
- 205 S 2nd St
- 313 Silverstone Cir
- 508 Saint Louis Ct
- 530 E Cypress St
- 206 S 3rd St
- 669 Lake Iberville Ct
- 826 Decatur St
- 18226 Esterbrook Rd
- 13.91 AC Louisiana 22
- 12 Acres Louisiana 22
- 20166 Louisiana 22
- 21163 Louisiana 22
- 551 Daybreak Dr
- 208 E Pecan St
- 0 E Pine St (Hwy 22) None Unit 817309
- 0 E Pine Hwy
- 125 Bernice St
- 925 E Pine St
- 145 Bernice St
- 131 Saxon St
- 0 Bernice St
- TBD Bernice St
- 1020 E Pine St
- 137 Saxon St
- 112 Velie St
- 144 Saxon St
- 155 Bernice St
- 193 Bernice St
- 850 E Pine St
- 1150 E Pine St
- 125 Wayne St
- 1133 E Pine St
- 1133 E Pine St Unit A
- 1133 E Pine St Unit B
Your Personal Tour Guide
Ask me questions while you tour the home.