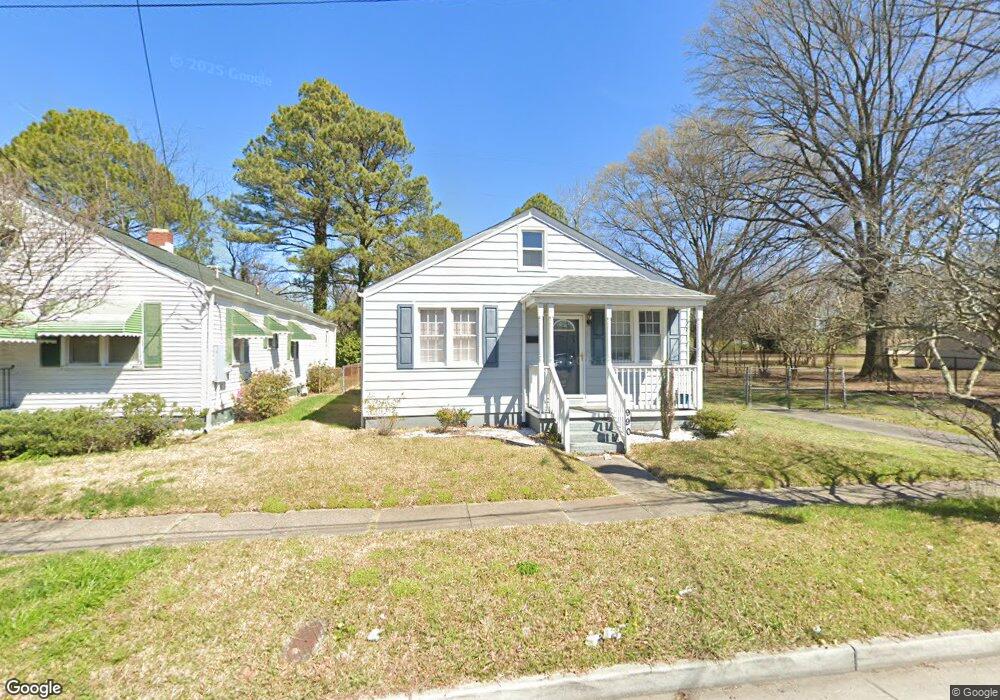
990 Galt St Norfolk, VA 23504
Olde Huntersville NeighborhoodEstimated Value: $221,000 - $247,000
3
Beds
2
Baths
1,200
Sq Ft
$199/Sq Ft
Est. Value
About This Home
This home is located at 990 Galt St, Norfolk, VA 23504 and is currently estimated at $239,276, approximately $199 per square foot. 990 Galt St is a home located in Norfolk City with nearby schools including Jacox Elementary School, Blair Middle School, and Granby High School.
Ownership History
Date
Name
Owned For
Owner Type
Purchase Details
Closed on
Mar 28, 2016
Sold by
Scott Joseph M and Gavin-Scott De'Etta M
Bought by
Jefferson-Nicholson Toni
Current Estimated Value
Home Financials for this Owner
Home Financials are based on the most recent Mortgage that was taken out on this home.
Original Mortgage
$133,536
Outstanding Balance
$105,693
Interest Rate
3.65%
Mortgage Type
FHA
Estimated Equity
$133,583
Purchase Details
Closed on
Jun 11, 2015
Sold by
Edith P Ricks Estate
Bought by
Scott Joseph M and Gavin-Scott De'Etta M
Create a Home Valuation Report for This Property
The Home Valuation Report is an in-depth analysis detailing your home's value as well as a comparison with similar homes in the area
Home Values in the Area
Average Home Value in this Area
Purchase History
| Date | Buyer | Sale Price | Title Company |
|---|---|---|---|
| Jefferson-Nicholson Toni | $136,000 | Fidelity National Title | |
| Scott Joseph M | $22,000 | Attorney |
Source: Public Records
Mortgage History
| Date | Status | Borrower | Loan Amount |
|---|---|---|---|
| Open | Jefferson-Nicholson Toni | $133,536 |
Source: Public Records
Tax History Compared to Growth
Tax History
| Year | Tax Paid | Tax Assessment Tax Assessment Total Assessment is a certain percentage of the fair market value that is determined by local assessors to be the total taxable value of land and additions on the property. | Land | Improvement |
|---|---|---|---|---|
| 2025 | $2,853 | $228,200 | $59,000 | $169,200 |
| 2024 | $2,617 | $212,800 | $59,000 | $153,800 |
| 2023 | $2,561 | $204,900 | $59,000 | $145,900 |
| 2022 | $2,189 | $175,100 | $40,800 | $134,300 |
| 2021 | $1,864 | $149,100 | $26,500 | $122,600 |
| 2020 | $1,864 | $149,100 | $26,500 | $122,600 |
| 2019 | $1,683 | $134,600 | $26,500 | $108,100 |
| 2018 | $1,649 | $131,900 | $26,500 | $105,400 |
| 2017 | $1,513 | $131,600 | $26,500 | $105,100 |
| 2016 | $1,487 | $100,000 | $26,500 | $73,500 |
| 2015 | $1,144 | $100,000 | $26,500 | $73,500 |
| 2014 | $1,144 | $100,000 | $26,500 | $73,500 |
Source: Public Records
Map
Nearby Homes