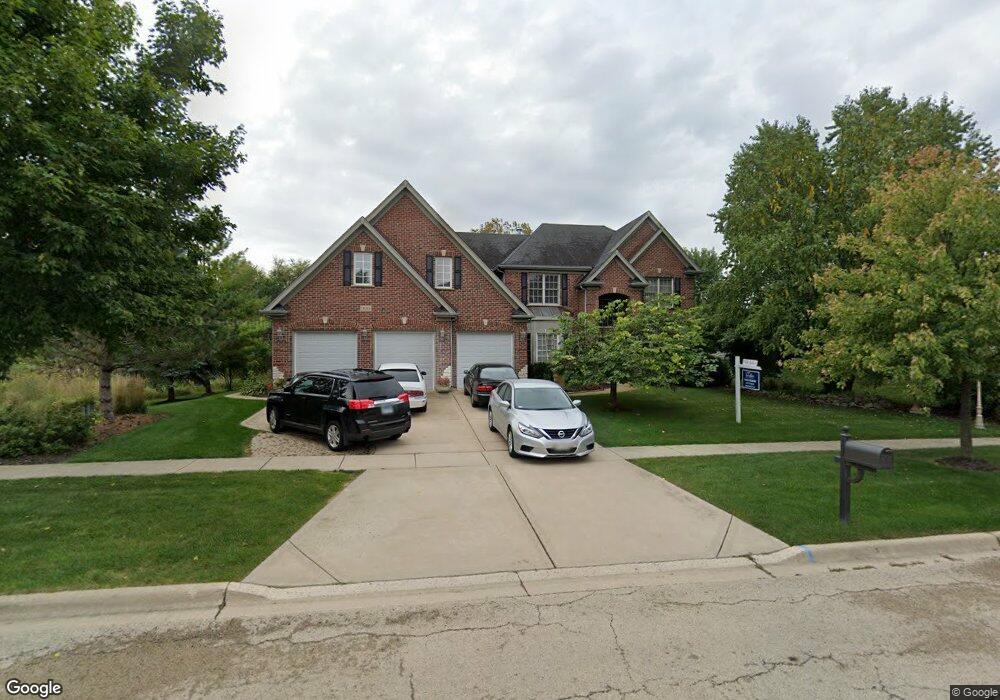
990 Lexington Ln Batavia, IL 60510
Southeast Batavia NeighborhoodEstimated Value: $597,000 - $686,274
4
Beds
4
Baths
3,582
Sq Ft
$179/Sq Ft
Est. Value
About This Home
This home is located at 990 Lexington Ln, Batavia, IL 60510 and is currently estimated at $642,319, approximately $179 per square foot. 990 Lexington Ln is a home located in Kane County with nearby schools including J B Nelson Elementary School, Sam Rotolo Middle School, and Batavia Sr High School.
Ownership History
Date
Name
Owned For
Owner Type
Purchase Details
Closed on
Nov 27, 2013
Sold by
Venice Peter J and Venice Nancy A
Bought by
Venice Peter J and Venice Nancy A
Current Estimated Value
Home Financials for this Owner
Home Financials are based on the most recent Mortgage that was taken out on this home.
Original Mortgage
$340,000
Outstanding Balance
$255,026
Interest Rate
4.3%
Mortgage Type
New Conventional
Estimated Equity
$387,293
Purchase Details
Closed on
Apr 15, 2013
Sold by
Venice Peter J and Venice Nancy A
Bought by
Venice Peter J and Venice Nancy A
Purchase Details
Closed on
Oct 17, 2002
Sold by
Mccarthy Builders Inc
Bought by
Venice Peter J and Venice Nancy A
Home Financials for this Owner
Home Financials are based on the most recent Mortgage that was taken out on this home.
Original Mortgage
$410,000
Interest Rate
6.18%
Purchase Details
Closed on
Nov 26, 2001
Sold by
West Suburban Bank
Bought by
Mccarthy Builders Inc
Home Financials for this Owner
Home Financials are based on the most recent Mortgage that was taken out on this home.
Original Mortgage
$351,232
Interest Rate
5%
Mortgage Type
Seller Take Back
Create a Home Valuation Report for This Property
The Home Valuation Report is an in-depth analysis detailing your home's value as well as a comparison with similar homes in the area
Home Values in the Area
Average Home Value in this Area
Purchase History
| Date | Buyer | Sale Price | Title Company |
|---|---|---|---|
| Venice Peter J | -- | None Available | |
| Venice Peter J | -- | None Available | |
| Venice Peter J | $516,500 | Multiple | |
| Mccarthy Builders Inc | $127,500 | First American Title Co |
Source: Public Records
Mortgage History
| Date | Status | Borrower | Loan Amount |
|---|---|---|---|
| Open | Venice Peter J | $340,000 | |
| Closed | Venice Peter J | $410,000 | |
| Previous Owner | Mccarthy Builders Inc | $351,232 |
Source: Public Records
Tax History Compared to Growth
Tax History
| Year | Tax Paid | Tax Assessment Tax Assessment Total Assessment is a certain percentage of the fair market value that is determined by local assessors to be the total taxable value of land and additions on the property. | Land | Improvement |
|---|---|---|---|---|
| 2024 | $13,620 | $188,267 | $17,802 | $170,465 |
| 2023 | $13,289 | $170,872 | $16,157 | $154,715 |
| 2022 | $12,984 | $159,693 | $15,100 | $144,593 |
| 2021 | $14,108 | $170,154 | $14,321 | $155,833 |
| 2020 | $13,757 | $166,883 | $14,046 | $152,837 |
| 2019 | $14,374 | $170,385 | $13,549 | $156,836 |
| 2018 | $14,493 | $171,629 | $14,481 | $157,148 |
| 2017 | $14,716 | $172,301 | $14,003 | $158,298 |
| 2016 | $14,400 | $167,282 | $13,595 | $153,687 |
| 2015 | -- | $163,473 | $13,285 | $150,188 |
| 2014 | -- | $158,328 | $12,867 | $145,461 |
| 2013 | -- | $164,336 | $15,770 | $148,566 |
Source: Public Records
Map
Nearby Homes
- 1017 Willow Ln Unit 2
- 1136 Pine Ct
- 621 Young Ave
- 817 Woodland Hills Rd
- 943 Orchard Ct
- 1332 Giese Rd Unit 2
- Lot 4 Manchester Ave
- 304 Manchester Ave
- 473 Bond Dr
- 860 S River St
- Lot 1 Center St
- 1025 E Wilson St
- 129 S Prairie St
- 637 E Wilson St
- 1267 Foxglove Dr
- 1273 Foxglove Dr
- 1277 Foxglove Dr
- 428 E Wilson St
- 1283 Foxglove Dr
- 1285 Foxglove Dr
- 980 Lexington Ln
- 1016 Knox Ln
- 991 Lexington Ln
- 981 Lexington Ln
- 1024 Knox Ln
- 1006 Lexington Ln
- 1009 Knox Ln
- 1016 S Raddant Rd
- 1017 Knox Ln
- 957 S Raddant Rd Unit 1
- 948 Knox Ln
- 1005 Lexington Ln
- 957 Knox Ln
- 1025 Knox Ln
- 1024 S Raddant Rd
- 1015 Lexington Ln
- 1031 Knox Ln
- 949 Knox Ln
- 940 Knox Ln
- 1032 S Raddant Rd