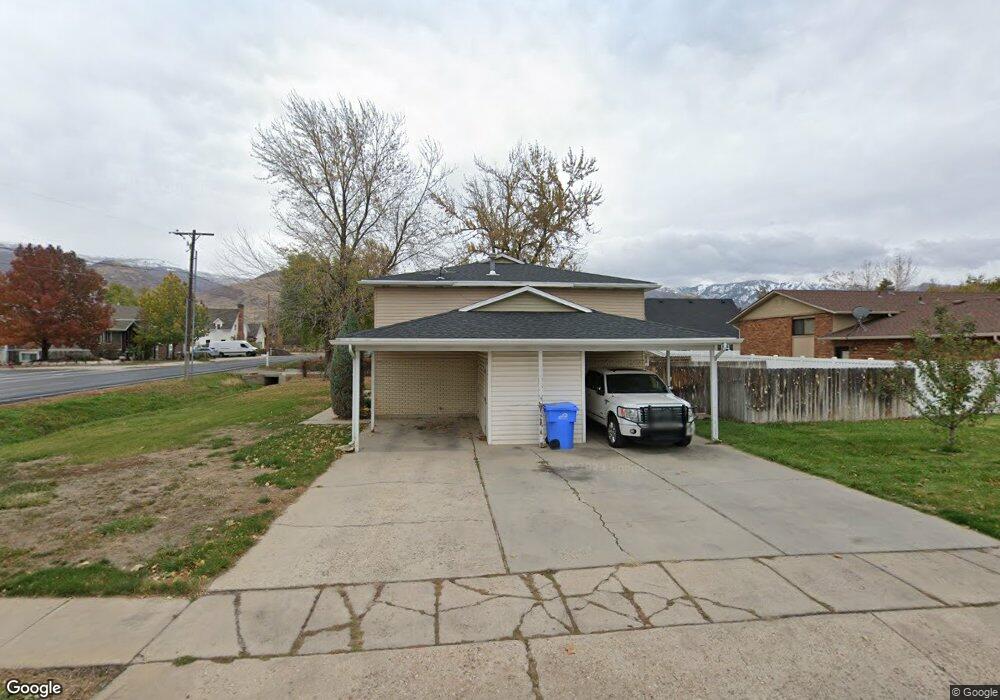
990 N 660 W West Bountiful, UT 84087
Estimated Value: $362,000 - $546,000
4
Beds
3
Baths
1,152
Sq Ft
$431/Sq Ft
Est. Value
About This Home
This home is located at 990 N 660 W, West Bountiful, UT 84087 and is currently estimated at $496,233, approximately $430 per square foot. 990 N 660 W is a home located in Davis County with nearby schools including West Bountiful Elementary School, Bountiful Junior High School, and Viewmont High School.
Ownership History
Date
Name
Owned For
Owner Type
Purchase Details
Closed on
Mar 26, 1998
Sold by
Milligan Kent and Milligan Debra H
Bought by
Thomas Gary R and Thomas Nicole
Current Estimated Value
Home Financials for this Owner
Home Financials are based on the most recent Mortgage that was taken out on this home.
Original Mortgage
$125,000
Outstanding Balance
$22,948
Interest Rate
7.06%
Estimated Equity
$473,285
Purchase Details
Closed on
Mar 4, 1998
Sold by
Hansen Leon Rulon and Hansen Shelley A
Bought by
Milligan Kent and Milligan Debra H
Home Financials for this Owner
Home Financials are based on the most recent Mortgage that was taken out on this home.
Original Mortgage
$125,000
Outstanding Balance
$22,948
Interest Rate
7.06%
Estimated Equity
$473,285
Purchase Details
Closed on
Aug 6, 1997
Sold by
Hansen Leon R and Hansen Shelley A
Bought by
Milligan Kent and Milligan Debra H
Create a Home Valuation Report for This Property
The Home Valuation Report is an in-depth analysis detailing your home's value as well as a comparison with similar homes in the area
Home Values in the Area
Average Home Value in this Area
Purchase History
| Date | Buyer | Sale Price | Title Company |
|---|---|---|---|
| Thomas Gary R | -- | Associated Title Company | |
| Milligan Kent | -- | Associated Title Company | |
| Milligan Kent | -- | Backman Stewart Title Servic |
Source: Public Records
Mortgage History
| Date | Status | Borrower | Loan Amount |
|---|---|---|---|
| Open | Thomas Gary R | $125,000 |
Source: Public Records
Tax History
| Year | Tax Paid | Tax Assessment Tax Assessment Total Assessment is a certain percentage of the fair market value that is determined by local assessors to be the total taxable value of land and additions on the property. | Land | Improvement |
|---|---|---|---|---|
| 2025 | $3,032 | $263,450 | $128,532 | $134,918 |
| 2024 | $2,946 | $262,899 | $105,571 | $157,328 |
| 2023 | $2,833 | $255,200 | $110,327 | $144,872 |
| 2022 | $2,805 | $467,000 | $173,673 | $293,327 |
| 2021 | $2,569 | $361,000 | $127,581 | $233,419 |
| 2020 | $2,338 | $325,000 | $119,379 | $205,621 |
| 2019 | $2,227 | $306,000 | $121,255 | $184,745 |
| 2018 | $2,013 | $272,000 | $122,680 | $149,320 |
| 2016 | $1,607 | $117,535 | $30,990 | $86,545 |
| 2015 | $1,550 | $107,800 | $30,990 | $76,810 |
| 2014 | $1,336 | $95,272 | $30,990 | $64,282 |
| 2013 | -- | $89,629 | $28,676 | $60,953 |
Source: Public Records
Map
Nearby Homes
- 366 W 1000 N
- 1449 N 725 W
- 1520 N 550 W
- 403 W 400 N Unit 1
- 290 N 500 W Unit 108
- 290 N 500 W Unit 305
- 563 N 200 W
- 1130 N 200 W
- 499 N 200 W Unit 18
- 499 N 200 W Unit 19
- 1625 Pages Place
- 449 W 200 N Unit 3
- 332 N 300 W
- 33 Tierra Vista Ct
- 55 N Peregrine Ln W Unit 7
- 55 N Peregrine Ln W Unit 4
- 314 W Center St Unit A83
- 75 N Peregrine Ln W Unit 8
- 591 W 2050 N
- 204 Lyman Ln
Your Personal Tour Guide
Ask me questions while you tour the home.