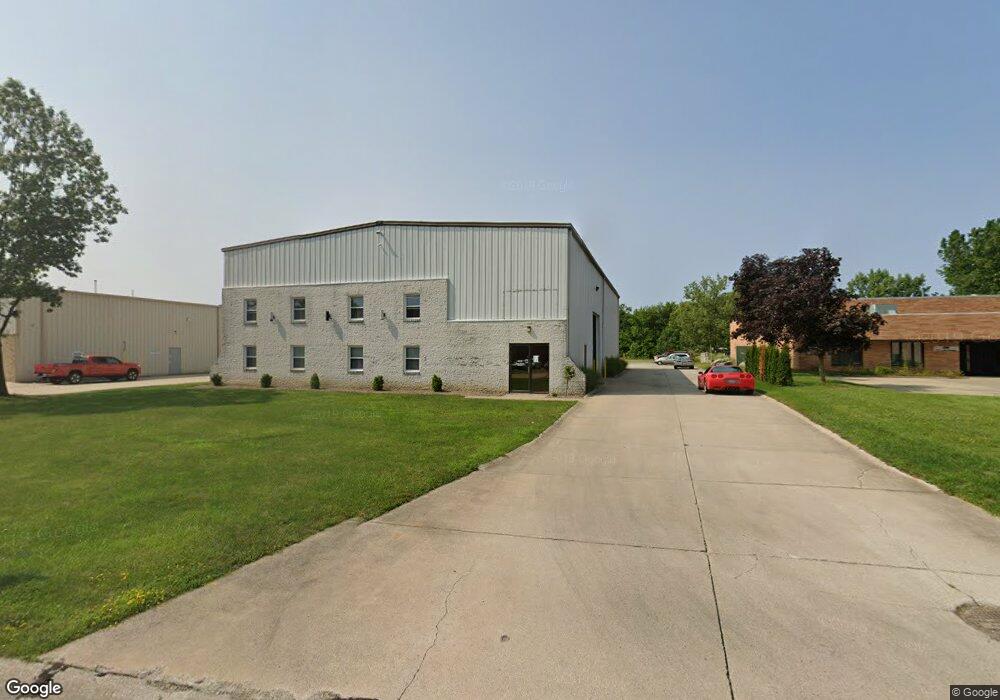
9900 York Theta Dr North Royalton, OH 44133
Estimated Value: $673,337
--
Bed
--
Bath
6,000
Sq Ft
$112/Sq Ft
Est. Value
About This Home
This home is located at 9900 York Theta Dr, North Royalton, OH 44133 and is currently estimated at $673,337, approximately $112 per square foot. 9900 York Theta Dr is a home located in Cuyahoga County with nearby schools including North Royalton Middle School, North Royalton High School, and Royal Redeemer Lutheran School.
Ownership History
Date
Name
Owned For
Owner Type
Purchase Details
Closed on
May 15, 2017
Sold by
Martin Brothers Real Estate Llc
Bought by
9900 York Theta Llc
Current Estimated Value
Purchase Details
Closed on
Jul 3, 2016
Sold by
Pgt Properties Llc
Bought by
Martin Brothers Real Estate Llc
Purchase Details
Closed on
Jan 22, 2009
Sold by
Martin Realty
Bought by
P G T Properties Llc
Home Financials for this Owner
Home Financials are based on the most recent Mortgage that was taken out on this home.
Original Mortgage
$377,200
Interest Rate
5.44%
Mortgage Type
Seller Take Back
Purchase Details
Closed on
Jun 24, 2005
Sold by
Calarco John A
Bought by
Martin Realty
Purchase Details
Closed on
Apr 13, 1984
Sold by
Cartwright Harley M and Cartwright Carol
Bought by
Calarco John A
Purchase Details
Closed on
Jan 1, 1983
Bought by
Cartwright Harley M and Cartwright Carol
Create a Home Valuation Report for This Property
The Home Valuation Report is an in-depth analysis detailing your home's value as well as a comparison with similar homes in the area
Home Values in the Area
Average Home Value in this Area
Purchase History
| Date | Buyer | Sale Price | Title Company |
|---|---|---|---|
| 9900 York Theta Llc | $365,000 | Boluevard Title Ag | |
| Martin Brothers Real Estate Llc | -- | Ohio Title Corp | |
| P G T Properties Llc | $377,200 | Ohio Title Corporation | |
| Martin Realty | $350,000 | Ohio Title Corp | |
| Calarco John A | $29,000 | -- | |
| Cartwright Harley M | -- | -- |
Source: Public Records
Mortgage History
| Date | Status | Borrower | Loan Amount |
|---|---|---|---|
| Previous Owner | P G T Properties Llc | $377,200 |
Source: Public Records
Tax History Compared to Growth
Tax History
| Year | Tax Paid | Tax Assessment Tax Assessment Total Assessment is a certain percentage of the fair market value that is determined by local assessors to be the total taxable value of land and additions on the property. | Land | Improvement |
|---|---|---|---|---|
| 2024 | $10,667 | $150,850 | $23,415 | $127,435 |
| 2023 | $10,041 | $137,980 | $23,770 | $114,210 |
| 2022 | $10,011 | $137,970 | $23,770 | $114,210 |
| 2021 | $10,224 | $137,970 | $23,770 | $114,210 |
| 2020 | $9,501 | $125,410 | $21,600 | $103,810 |
| 2019 | $9,243 | $358,300 | $61,700 | $296,600 |
| 2018 | $9,000 | $125,410 | $21,600 | $103,810 |
| 2017 | $9,083 | $116,900 | $17,850 | $99,050 |
| 2016 | $8,653 | $116,900 | $17,850 | $99,050 |
| 2015 | $29,847 | $116,900 | $17,850 | $99,050 |
| 2014 | $19,003 | $118,100 | $18,030 | $100,070 |
Source: Public Records
Map
Nearby Homes
- 10342 Independence Dr Unit 21B
- 10560 Independence Dr Unit 25A
- 10364 Independence Dr Unit 19c
- 9761 Sunrise Blvd
- 9611 Sunrise Blvd Unit K2
- 9821 Sunrise Blvd Unit o1
- 11445 Harbour Light Dr
- 9660 Cove Dr Unit F13
- 9530 Cove Dr Unit C-25
- 9510 Cove Dr Unit C12
- 9710 Cove Dr Unit 23G
- 9800 Cove Dr Unit H2
- 11550 York Rd
- 11650 Harbour Light Dr Unit 1650
- 9035 Wallings Rd
- 12906 Cartwright Pkwy
- 13000 Cartwright Pkwy
- 11806 Harbour Light Dr Unit 1806
- 13831 Woodcroft Trace
- 12701 Gordon St
- 9920 York Theta Dr
- 9940 York-Theta Dr
- VL York-Delta Dr
- 0 York Delta Dr Unit 3981511
- 0 York Delta Dr Unit 215393
- 0 York Delta Dr Unit 220513
- 0 York Delta Dr Unit 219847
- 0 York Delta Dr Unit 9022509
- 0 York Delta Dr Unit 9028582
- 0 York Delta Dr Unit 9035602
- 0 York Delta Dr Unit 9037203
- 0 York Delta Dr Unit 9039722
- 0 York Delta Dr Unit 9042586
- 0 York Delta Dr Unit 4286756
- 0 York Delta Dr Unit 4153670
- 0 York Delta Dr Unit 4061943
- York Delta Dr Unit 2452567
- York Delta Dr Unit 3000118
- York Delta Dr Unit 3384643
- York Delta Dr Unit 3676253