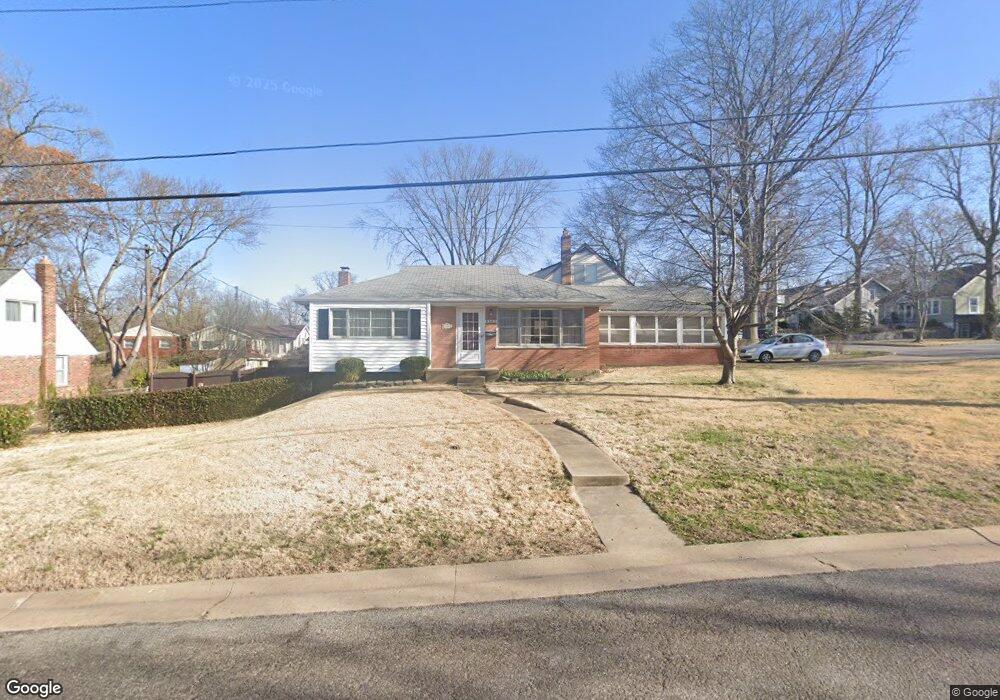
9901 Hudson Ave Saint Louis, MO 63119
Estimated Value: $271,000 - $294,000
2
Beds
1
Bath
864
Sq Ft
$323/Sq Ft
Est. Value
About This Home
This home is located at 9901 Hudson Ave, Saint Louis, MO 63119 and is currently estimated at $278,956, approximately $322 per square foot. 9901 Hudson Ave is a home located in St. Louis County with nearby schools including Hudson Elementary School, Hixson Middle School, and Webster Groves High School.
Ownership History
Date
Name
Owned For
Owner Type
Purchase Details
Closed on
Dec 19, 2003
Sold by
Krapfl Stephen J and Krapfl Dolores M
Bought by
Krapfl Stephen J and Krapfl Dolores M
Current Estimated Value
Home Financials for this Owner
Home Financials are based on the most recent Mortgage that was taken out on this home.
Original Mortgage
$141,750
Outstanding Balance
$69,646
Interest Rate
6.75%
Mortgage Type
New Conventional
Estimated Equity
$209,310
Purchase Details
Closed on
Feb 21, 2002
Sold by
Krapel Stephen J and Krapel Dolores M
Bought by
Krapfl Stephen J and Krapfl Dolores M
Purchase Details
Closed on
May 28, 1998
Sold by
Sicilia Vincent S and Sicilia Kathryn N
Bought by
Krapfl Stephen J and Krapfl Dolores M
Home Financials for this Owner
Home Financials are based on the most recent Mortgage that was taken out on this home.
Original Mortgage
$96,029
Interest Rate
7.17%
Mortgage Type
FHA
Create a Home Valuation Report for This Property
The Home Valuation Report is an in-depth analysis detailing your home's value as well as a comparison with similar homes in the area
Home Values in the Area
Average Home Value in this Area
Purchase History
| Date | Buyer | Sale Price | Title Company |
|---|---|---|---|
| Krapfl Stephen J | -- | -- | |
| Krapfl Stephen J | -- | -- | |
| Krapfl Stephen J | -- | -- |
Source: Public Records
Mortgage History
| Date | Status | Borrower | Loan Amount |
|---|---|---|---|
| Open | Krapfl Stephen J | $141,750 | |
| Closed | Krapfl Stephen J | $96,029 |
Source: Public Records
Tax History Compared to Growth
Tax History
| Year | Tax Paid | Tax Assessment Tax Assessment Total Assessment is a certain percentage of the fair market value that is determined by local assessors to be the total taxable value of land and additions on the property. | Land | Improvement |
|---|---|---|---|---|
| 2025 | $2,961 | $46,000 | $30,460 | $15,540 |
| 2024 | $2,961 | $41,040 | $21,320 | $19,720 |
| 2023 | $2,961 | $41,040 | $21,320 | $19,720 |
| 2022 | $3,023 | $38,670 | $21,320 | $17,350 |
| 2021 | $3,003 | $38,670 | $21,320 | $17,350 |
| 2020 | $2,840 | $34,940 | $18,280 | $16,660 |
| 2019 | $2,823 | $34,940 | $18,280 | $16,660 |
| 2018 | $2,507 | $27,230 | $13,510 | $13,720 |
| 2017 | $2,495 | $27,230 | $13,510 | $13,720 |
| 2016 | $2,561 | $26,680 | $11,610 | $15,070 |
| 2015 | $2,469 | $26,680 | $11,610 | $15,070 |
| 2014 | $2,502 | $26,330 | $9,500 | $16,830 |
Source: Public Records
Map
Nearby Homes
- 1119 Gilbert Ave
- 1120 Gilbert Ave
- 9839 Warson Pointe Dr
- 9840 Oak Haven Ave
- 9844 Oak Haven Ave
- 1146 Kortwright Ave
- 1105 Timberlane Dr
- 65 Ridge Line Dr
- 1048 Martha Ln
- 9721 Greenwood Terrace
- 9780 Old Warson Rd
- 9714 Whitestone Terrace
- 1322 Kortwright Ave
- 1509 Andrew Dr
- 1235 Charlane Ct
- 9740 Old Warson Rd
- 1242 Charlane Ct
- 515 Bismark Ave
- 529 Cyril Dr
- 1025 Glenmoor Ln
- 1103 Gilbert Ave
- 9905 Hudson Ave
- 1105 Gilbert Ave
- 9801 Cottonwood Ln
- 9853 Hudson Ave
- 9909 Hudson Ave
- 9800 Cottonwood Ln
- 9803 Cottonwood Ln
- 1107 Gilbert Ave
- 9913 Hudson Ave
- 1110 Gilbert Ave
- 9849 Hudson Ave
- 9914 Hudson Ave
- 1117 Gilbert Ave
- 15 Eldorado Ct
- 9917 Hudson Ave
- 9805 Cottonwood Ln
- 14 Eldorado Ct
- 9904 Gilbrook Ave
- 1104 Twinbrook Dr