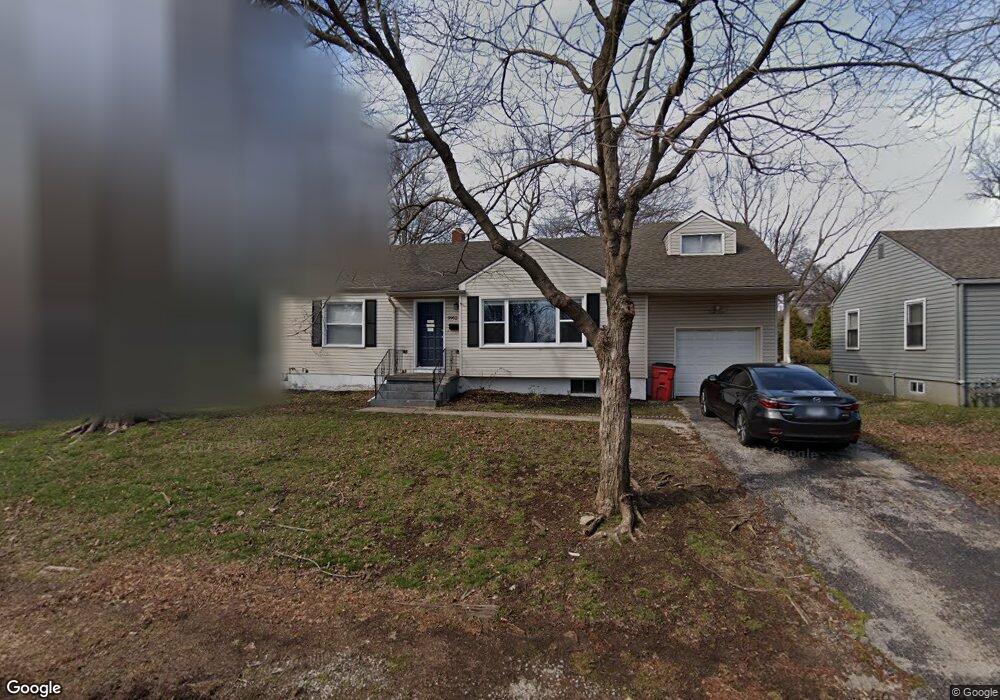
9902 E 34th St S Independence, MO 64052
Rock Creek South NeighborhoodEstimated Value: $163,502 - $219,000
3
Beds
1
Bath
1,100
Sq Ft
$169/Sq Ft
Est. Value
About This Home
This home is located at 9902 E 34th St S, Independence, MO 64052 and is currently estimated at $186,376, approximately $169 per square foot. 9902 E 34th St S is a home located in Jackson County with nearby schools including Three Trails Elementary School, Clifford H. Nowlin Middle School, and Van Horn High School.
Ownership History
Date
Name
Owned For
Owner Type
Purchase Details
Closed on
Oct 23, 2019
Sold by
Community Invest Llc
Bought by
Walsh Brian E
Current Estimated Value
Home Financials for this Owner
Home Financials are based on the most recent Mortgage that was taken out on this home.
Original Mortgage
$89,962
Outstanding Balance
$78,811
Interest Rate
3.5%
Mortgage Type
New Conventional
Estimated Equity
$107,565
Purchase Details
Closed on
Jul 15, 2019
Sold by
Lamb Conrad E
Bought by
Community Invest Llc
Home Financials for this Owner
Home Financials are based on the most recent Mortgage that was taken out on this home.
Original Mortgage
$100,000
Interest Rate
3.9%
Mortgage Type
New Conventional
Purchase Details
Closed on
Oct 6, 2016
Sold by
Lamb Lucy H
Bought by
Lamb Lucy H and Lamb Conrad E
Purchase Details
Closed on
Mar 27, 2003
Sold by
Lewis Willard V and Lewis Lawana Jean
Bought by
Lamb Paul B and Lamb Lucy H
Create a Home Valuation Report for This Property
The Home Valuation Report is an in-depth analysis detailing your home's value as well as a comparison with similar homes in the area
Home Values in the Area
Average Home Value in this Area
Purchase History
| Date | Buyer | Sale Price | Title Company |
|---|---|---|---|
| Walsh Brian E | -- | None Available | |
| Community Invest Llc | -- | Clear Title Nationwide Inc | |
| Lamb Lucy H | -- | None Available | |
| Lamb Paul B | -- | Assured Quality Title Co |
Source: Public Records
Mortgage History
| Date | Status | Borrower | Loan Amount |
|---|---|---|---|
| Open | Walsh Brian E | $89,962 | |
| Previous Owner | Community Invest Llc | $100,000 |
Source: Public Records
Tax History
| Year | Tax Paid | Tax Assessment Tax Assessment Total Assessment is a certain percentage of the fair market value that is determined by local assessors to be the total taxable value of land and additions on the property. | Land | Improvement |
|---|---|---|---|---|
| 2025 | $1,333 | $18,594 | $3,692 | $14,902 |
| 2024 | $1,301 | $18,702 | $2,174 | $16,528 |
| 2023 | $1,301 | $18,702 | $2,096 | $16,606 |
| 2022 | $1,071 | $14,060 | $2,603 | $11,457 |
| 2021 | $1,067 | $14,060 | $2,603 | $11,457 |
| 2020 | $964 | $12,363 | $2,603 | $9,760 |
| 2019 | $949 | $12,363 | $2,603 | $9,760 |
| 2018 | $847 | $10,721 | $1,859 | $8,862 |
| 2017 | $847 | $10,721 | $1,859 | $8,862 |
| 2016 | $792 | $9,785 | $2,153 | $7,632 |
| 2014 | $752 | $9,500 | $2,090 | $7,410 |
Source: Public Records
Map
Nearby Homes
- 9801 E 33rd St S
- 3310 S Maywood Ave
- 3410 Blue Ridge Blvd
- 3228 S Cedar Ave
- 9930 E 36th St S
- 3401 S Denton Rd
- 9812 Linwood Blvd
- 3320 Blue Ridge Blvd
- 10501 E 35th St S
- 10212 E 31st St S
- 3407 S Blue Ridge Cut Off N A
- 00 S Denton Rd
- 3720 Crescent Ave
- 2929 S Northern Blvd
- 2916 S Northern Blvd
- 3738 Ditzler Ave
- 3734 Ditzler Ave
- 3730 Ditzler Ave
- 3805 Laurel Ave
- 2916 S Mason Ave
- 9904 E 34th St S N A
- 9904 E 34th St S
- 9900 E 34th St S
- 9906 E 34th St S
- 9903 E 34th St S
- 9810 E 34th St S
- 9901 E 34th St S
- 9905 E 34th St S
- 3362 Blue Ridge Blvd
- 3364 Blue Ridge Blvd
- 9908 E 34th St S
- 9907 E 34th St S
- 9808 E 34th St S
- 3360 Blue Ridge Blvd
- 3400 S Home Ave
- 3366 Blue Ridge Blvd
- 3405 S Home Ave
- 10000 E 34th St S
- 9806 E 34th St S
- 3402 S Home Ave
Your Personal Tour Guide
Ask me questions while you tour the home.