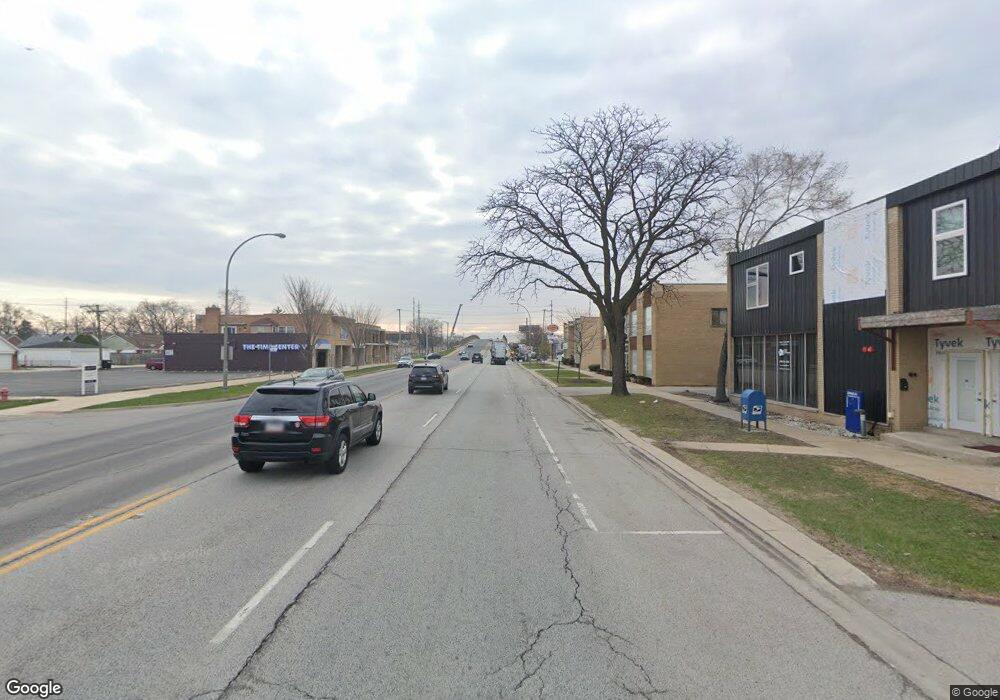
9902 W Roosevelt Rd Westchester, IL 60154
Estimated Value: $979,659
--
Bed
--
Bath
14,020
Sq Ft
$70/Sq Ft
Est. Value
About This Home
This home is located at 9902 W Roosevelt Rd, Westchester, IL 60154 and is currently estimated at $979,659, approximately $69 per square foot. 9902 W Roosevelt Rd is a home located in Cook County with nearby schools including Westchester Primary School, Westchester Intermediate School, and Westchester Middle School.
Ownership History
Date
Name
Owned For
Owner Type
Purchase Details
Closed on
Jul 27, 2021
Sold by
Indigo Realty Llc
Bought by
Chicago Sky Realty Llc
Current Estimated Value
Purchase Details
Closed on
Oct 17, 2014
Sold by
Parkway Bank & Trust Company
Bought by
Indigo Realty Llc
Purchase Details
Closed on
Jun 3, 2004
Sold by
Mule Nicolo and Mule Giuseppe
Bought by
Parkway Bank & Trust Co and Trust #13768
Purchase Details
Closed on
Mar 3, 2004
Sold by
Khakshour Joseph Z
Bought by
Mule Nicolo and Mule Giuseppe
Home Financials for this Owner
Home Financials are based on the most recent Mortgage that was taken out on this home.
Original Mortgage
$1,210,000
Interest Rate
6.25%
Mortgage Type
Commercial
Create a Home Valuation Report for This Property
The Home Valuation Report is an in-depth analysis detailing your home's value as well as a comparison with similar homes in the area
Home Values in the Area
Average Home Value in this Area
Purchase History
| Date | Buyer | Sale Price | Title Company |
|---|---|---|---|
| Chicago Sky Realty Llc | $800,000 | Stewart Title | |
| Indigo Realty Llc | -- | None Available | |
| Parkway Bank & Trust Co | -- | Chicago Title Insurance Comp | |
| Mule Nicolo | $1,700,000 | Git |
Source: Public Records
Mortgage History
| Date | Status | Borrower | Loan Amount |
|---|---|---|---|
| Previous Owner | Mule Nicolo | $1,210,000 |
Source: Public Records
Tax History Compared to Growth
Tax History
| Year | Tax Paid | Tax Assessment Tax Assessment Total Assessment is a certain percentage of the fair market value that is determined by local assessors to be the total taxable value of land and additions on the property. | Land | Improvement |
|---|---|---|---|---|
| 2024 | $72,084 | $274,661 | $98,819 | $175,842 |
| 2023 | $61,018 | $274,661 | $98,819 | $175,842 |
| 2022 | $61,018 | $200,001 | $98,819 | $101,182 |
| 2021 | $59,063 | $200,000 | $98,819 | $101,181 |
| 2020 | $53,051 | $183,868 | $98,819 | $85,049 |
| 2019 | $69,224 | $245,040 | $88,231 | $156,809 |
| 2018 | $68,319 | $245,040 | $88,231 | $156,809 |
| 2017 | $63,306 | $231,502 | $88,231 | $143,271 |
| 2016 | $53,562 | $183,654 | $84,702 | $98,952 |
| 2015 | $38,257 | $132,881 | $84,702 | $48,179 |
| 2014 | $62,113 | $220,844 | $84,702 | $136,142 |
| 2013 | $46,942 | $186,737 | $84,702 | $102,035 |
Source: Public Records
Map
Nearby Homes
- 923 Manchester Ave
- 920 Suffolk Ave
- 1119 Newcastle Ave
- 10072 Drury Ln
- 814 Norfolk Ave
- 805 Norfolk Ave
- 750 Bristol Ave
- 1016 Hull Ave
- 1433 Bristol Ave
- 626 Manchester Ave
- 1500 Bristol Ave
- 2003 S 24th Ave
- 723 Balmoral Ave
- 1601 Bristol Ave
- 1108 31st Ave
- 1102 31st Ave
- 1623 Manchester Ave
- 2320 S 22nd Ave
- 1245 S Mannheim Rd Unit 2
- 1247 S Mannheim Rd Unit 3
- 9914 W Roosevelt Rd
- 9920 W Roosevelt Rd
- 1143 Norfolk Ave
- 1142 Manchester Ave
- 9919 W Roosevelt Rd Unit 1
- 9919 W Roosevelt Rd Unit 2
- 9919 W Roosevelt Rd
- 1139 Norfolk Ave
- 1136 Manchester Ave
- 9900 Roosevelt Rd
- 1132 Manchester Ave
- 1133 Norfolk Ave
- 9919 Roosevelt Rd Unit 3
- 9919 Roosevelt Rd
- 9919 Roosevelt Rd
- 9919 Roosevelt Rd Unit 101
- 9865 W Roosevelt Rd Unit 206
- 9865 W Roosevelt Rd Unit 200
- 9865 W Roosevelt Rd Unit 203
- 9865 W Roosevelt Rd Unit 202