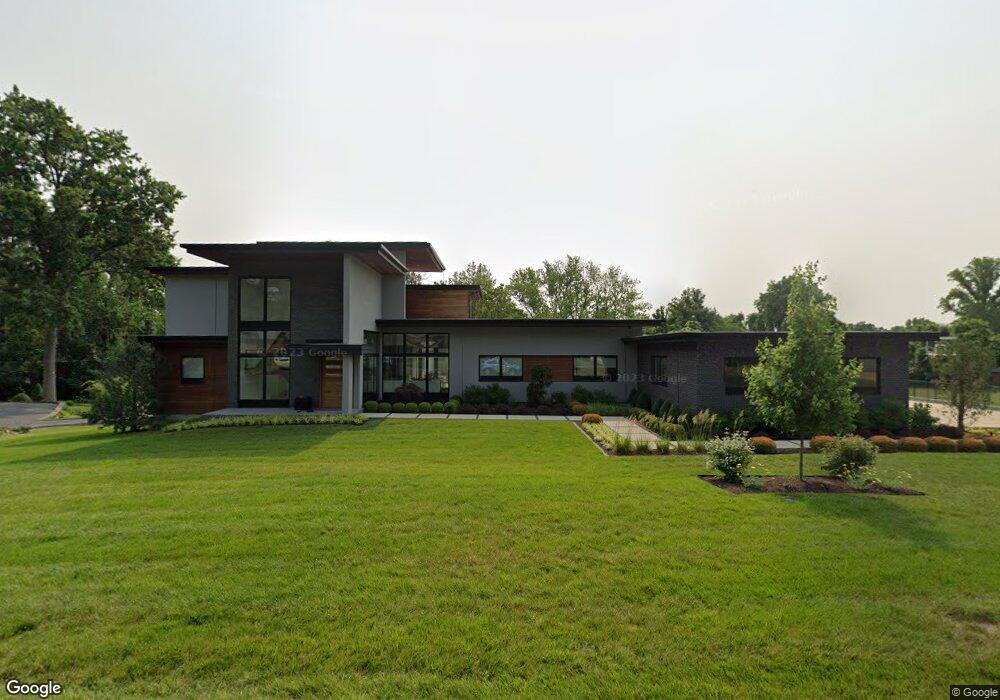
9904 Meppen Dr Saint Louis, MO 63128
Estimated Value: $993,000 - $2,151,977
4
Beds
6
Baths
7,881
Sq Ft
$197/Sq Ft
Est. Value
About This Home
This home is located at 9904 Meppen Dr, Saint Louis, MO 63128 and is currently estimated at $1,550,494, approximately $196 per square foot. 9904 Meppen Dr is a home located in St. Louis County with nearby schools including Concord Elementary School, Sperreng Middle School, and Lindbergh High School.
Ownership History
Date
Name
Owned For
Owner Type
Purchase Details
Closed on
Jul 8, 2020
Sold by
Clay Aron and Clay Caroline
Bought by
Clay Aron L and Clay Caroline S
Current Estimated Value
Purchase Details
Closed on
Apr 16, 2018
Sold by
Clay Ama and Clay Caroline
Bought by
Clay Caroline and The Caroline Clay Revocable Trust
Home Financials for this Owner
Home Financials are based on the most recent Mortgage that was taken out on this home.
Original Mortgage
$1,400,000
Outstanding Balance
$1,191,405
Interest Rate
4%
Mortgage Type
Adjustable Rate Mortgage/ARM
Estimated Equity
$359,089
Purchase Details
Closed on
May 20, 2016
Sold by
Jeanne C Gansloser Revocable Living Trus
Bought by
Clay Aron and Clay Caroline
Purchase Details
Closed on
Nov 21, 2011
Sold by
Gansloser Jeanne C
Bought by
Gansloser Jeanne C and Pennypacker Claire Gansloser
Create a Home Valuation Report for This Property
The Home Valuation Report is an in-depth analysis detailing your home's value as well as a comparison with similar homes in the area
Home Values in the Area
Average Home Value in this Area
Purchase History
| Date | Buyer | Sale Price | Title Company |
|---|---|---|---|
| Clay Aron L | -- | None Available | |
| Clay Aron | -- | None Available | |
| Clay Caroline | -- | Old Republic National Title | |
| Clay Aron | -- | Security Title Ins Agency Cm | |
| Gansloser Jeanne C | -- | None Available |
Source: Public Records
Mortgage History
| Date | Status | Borrower | Loan Amount |
|---|---|---|---|
| Open | Clay Caroline | $1,400,000 |
Source: Public Records
Tax History Compared to Growth
Tax History
| Year | Tax Paid | Tax Assessment Tax Assessment Total Assessment is a certain percentage of the fair market value that is determined by local assessors to be the total taxable value of land and additions on the property. | Land | Improvement |
|---|---|---|---|---|
| 2025 | $18,208 | $323,860 | $31,450 | $292,410 |
| 2024 | $18,208 | $279,990 | $31,450 | $248,540 |
| 2023 | $18,161 | $279,990 | $31,450 | $248,540 |
| 2022 | $15,639 | $231,440 | $31,450 | $199,990 |
| 2021 | $15,086 | $231,440 | $31,450 | $199,990 |
| 2020 | $19,921 | $294,880 | $19,970 | $274,910 |
| 2019 | $1,346 | $19,970 | $19,970 | $0 |
| 2018 | $943 | $12,730 | $12,730 | $0 |
| 2017 | $3,100 | $42,310 | $12,730 | $29,580 |
| 2016 | $2,787 | $36,120 | $12,730 | $23,390 |
| 2015 | $2,746 | $36,120 | $12,730 | $23,390 |
| 2014 | $4,000 | $52,130 | $8,110 | $44,020 |
Source: Public Records
Map
Nearby Homes
- 20 Oleander Dr
- 10508 Stephenson Dr
- 10000 Hilltop Dr
- 10627 Leebur Dr
- 9918 Benbury Ct Unit 1D
- 10727 Roxanna Dr
- 10652 Roanna Ln
- 9448 Parklind Dr
- 9411 Gates Manor Ct
- 9404 Gates Manor Ct
- 10755 Kennerly Rd
- 10315 Kennerly Rd
- 4328 S Lindbergh Blvd
- 12224 Bird Haven Ln
- 10124 Carolynne Dr
- 10573 Carroll Wood Way
- 10831 Carroll Wood Way
- 10525 Carroll Wood Way
- 10819 Carroll Wood Way
- 10140 Sakura Dr