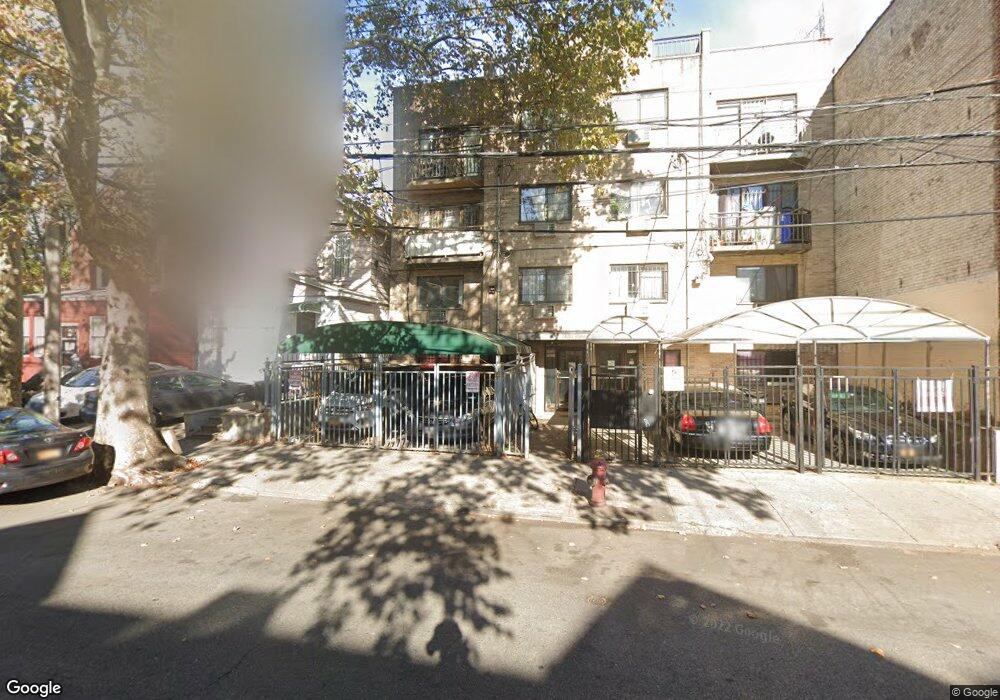
9905 43rd Ave Unit 4B Corona, NY 11368
Corona NeighborhoodEstimated Value: $334,000 - $381,000
1
Bed
1
Bath
440
Sq Ft
$823/Sq Ft
Est. Value
About This Home
This home is located at 9905 43rd Ave Unit 4B, Corona, NY 11368 and is currently estimated at $362,058, approximately $822 per square foot. 9905 43rd Ave Unit 4B is a home located in Queens County with nearby schools including P.S. 110, Corona Arts And Sciences Academy, and John Bowne High School.
Ownership History
Date
Name
Owned For
Owner Type
Purchase Details
Closed on
Nov 21, 2018
Sold by
Xg Li Sing Yi and Xg Zhuo Edward
Bought by
Huang Meiwen and Yang Yuehua
Current Estimated Value
Home Financials for this Owner
Home Financials are based on the most recent Mortgage that was taken out on this home.
Original Mortgage
$180,000
Outstanding Balance
$158,274
Interest Rate
4.8%
Mortgage Type
Purchase Money Mortgage
Estimated Equity
$203,784
Purchase Details
Closed on
Apr 21, 2016
Sold by
Leung' S Realty Corp
Bought by
Li Sing Yi and Zhuo Edward Xg
Purchase Details
Closed on
Nov 25, 2014
Sold by
Astoria Plaza Llc
Bought by
Leung'S Realty Corp
Purchase Details
Closed on
Jul 21, 1998
Sold by
Khodabakhsh Sohrab
Bought by
Astoria Plaza Llc
Purchase Details
Closed on
Jun 30, 1998
Sold by
Hud
Bought by
Khodabakhsh Sohrab
Create a Home Valuation Report for This Property
The Home Valuation Report is an in-depth analysis detailing your home's value as well as a comparison with similar homes in the area
Home Values in the Area
Average Home Value in this Area
Purchase History
| Date | Buyer | Sale Price | Title Company |
|---|---|---|---|
| Huang Meiwen | $300,000 | -- | |
| Li Sing Yi | $235,000 | -- | |
| Leung'S Realty Corp | $183,750 | -- | |
| Astoria Plaza Llc | $25,000 | First American Title Ins Co | |
| Khodabakhsh Sohrab | $29,000 | -- |
Source: Public Records
Mortgage History
| Date | Status | Borrower | Loan Amount |
|---|---|---|---|
| Open | Huang Meiwen | $180,000 |
Source: Public Records
Tax History Compared to Growth
Tax History
| Year | Tax Paid | Tax Assessment Tax Assessment Total Assessment is a certain percentage of the fair market value that is determined by local assessors to be the total taxable value of land and additions on the property. | Land | Improvement |
|---|---|---|---|---|
| 2025 | $3,703 | $31,990 | $6 | $31,984 |
| 2024 | $3,703 | $29,620 | $7 | $29,613 |
| 2023 | $3,429 | $27,426 | $8 | $27,418 |
| 2022 | $3,225 | $27,782 | $8 | $27,774 |
| 2021 | $2,994 | $24,405 | $8 | $24,397 |
| 2020 | $2,957 | $28,018 | $8 | $28,010 |
| 2019 | $2,731 | $24,583 | $8 | $24,575 |
| 2018 | $2,555 | $20,090 | $8 | $20,082 |
| 2017 | $2,426 | $19,074 | $6 | $19,068 |
| 2016 | $2,347 | $19,074 | $6 | $19,068 |
| 2015 | $435 | $18,435 | $7 | $18,428 |
| 2014 | $435 | $18,082 | $295 | $17,787 |
Source: Public Records
Map
Nearby Homes
- 9905 43rd Ave Unit 2A
- 40-45 99th St
- 97-28 41st Ave
- 4036 100th St
- 9720 43rd Ave Unit 3
- 100-15 40th Rd
- 97-10 43rd Ave
- 100-04 Spruce St
- 9628 41st Ave
- 40-29 102nd St
- 4048 97th St Unit 3E
- 40-48 97th St Unit 3D
- 40-48 97th St Unit 2
- 40-48 97th St Unit 1B
- 103-02 42nd Ave Unit 4D
- 102-23 43rd Ave Unit 2B
- 45-04 102nd St
- 101-17 46th Ave
- 10121 46th Ave
- 100-17 39th Ave
- 9905 43rd Ave Unit 4B
- 9905 43rd Ave Unit 4A
- 9905 43rd Ave Unit 3B
- 9905 43rd Ave Unit 3A
- 9905 43rd Ave Unit 2B
- 9905 43rd Ave Unit 1B
- 9905 43rd Ave Unit 1A
- 9905 43rd Ave Unit OP1
- 9905 43rd Ave Unit OP2
- 9905 43rd Ave
- 9907 43rd Ave Unit 4B
- 9907 43rd Ave Unit 4A
- 9907 43rd Ave Unit 3B
- 9907 43rd Ave Unit 3A
- 9907 43rd Ave Unit 2B
- 9907 43rd Ave Unit 2A
- 9907 43rd Ave Unit 1B
- 9907 43rd Ave Unit 1A
- 9907 43rd Ave Unit 2B
- 9907 43rd Ave Unit OP1