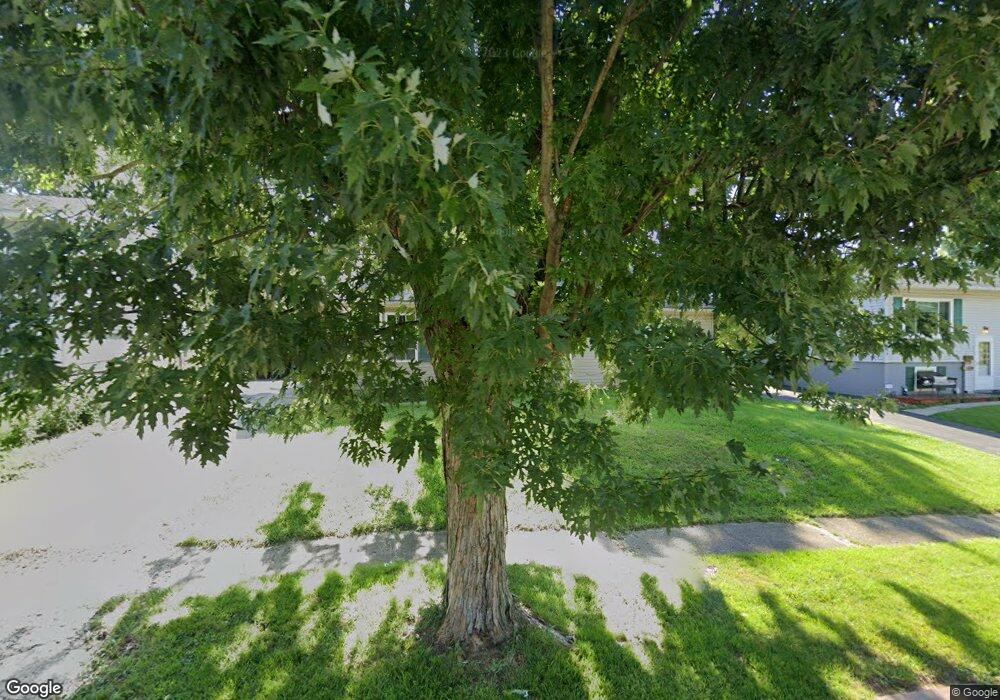
9908 Crusader Dr Cincinnati, OH 45251
Estimated Value: $175,000 - $203,000
3
Beds
2
Baths
1,120
Sq Ft
$167/Sq Ft
Est. Value
About This Home
This home is located at 9908 Crusader Dr, Cincinnati, OH 45251 and is currently estimated at $187,312, approximately $167 per square foot. 9908 Crusader Dr is a home located in Hamilton County with nearby schools including Taylor Elementary School, Pleasant Run Elementary School, and Pleasant Run Middle School.
Ownership History
Date
Name
Owned For
Owner Type
Purchase Details
Closed on
Jun 8, 2005
Sold by
Advanced Construction Of Cincinnati Ltd
Bought by
Sherbert Robert A and Sherbert Kelly L
Current Estimated Value
Home Financials for this Owner
Home Financials are based on the most recent Mortgage that was taken out on this home.
Original Mortgage
$87,200
Outstanding Balance
$50,269
Interest Rate
7.85%
Mortgage Type
Fannie Mae Freddie Mac
Estimated Equity
$137,043
Purchase Details
Closed on
Feb 6, 2004
Sold by
Gray Phillip and Gray Terry
Bought by
Advanced Construction Of Cincinnati Llc
Purchase Details
Closed on
Apr 4, 2002
Sold by
Grote Jane M
Bought by
Gray Phillip and Gray Terri
Purchase Details
Closed on
Dec 17, 1997
Sold by
Abbott Junior N
Bought by
Abbott Stella A
Create a Home Valuation Report for This Property
The Home Valuation Report is an in-depth analysis detailing your home's value as well as a comparison with similar homes in the area
Home Values in the Area
Average Home Value in this Area
Purchase History
| Date | Buyer | Sale Price | Title Company |
|---|---|---|---|
| Sherbert Robert A | $109,000 | Prominent Title Agency Llc | |
| Advanced Construction Of Cincinnati Llc | $9,500 | -- | |
| Gray Phillip | $4,000 | -- | |
| Abbott Stella A | -- | -- |
Source: Public Records
Mortgage History
| Date | Status | Borrower | Loan Amount |
|---|---|---|---|
| Open | Sherbert Robert A | $87,200 |
Source: Public Records
Tax History
| Year | Tax Paid | Tax Assessment Tax Assessment Total Assessment is a certain percentage of the fair market value that is determined by local assessors to be the total taxable value of land and additions on the property. | Land | Improvement |
|---|---|---|---|---|
| 2025 | $2,827 | $48,801 | $8,789 | $40,012 |
| 2024 | $2,637 | $48,801 | $8,789 | $40,012 |
| 2023 | $2,651 | $48,801 | $8,789 | $40,012 |
| 2022 | $2,522 | $37,885 | $7,753 | $30,132 |
| 2021 | $2,500 | $37,885 | $7,753 | $30,132 |
| 2020 | $2,526 | $37,885 | $7,753 | $30,132 |
| 2019 | $2,188 | $30,552 | $6,251 | $24,301 |
| 2018 | $1,965 | $30,552 | $6,251 | $24,301 |
| 2017 | $1,863 | $30,552 | $6,251 | $24,301 |
| 2016 | $1,929 | $31,224 | $6,307 | $24,917 |
| 2015 | $1,947 | $31,224 | $6,307 | $24,917 |
| 2014 | $1,950 | $31,224 | $6,307 | $24,917 |
| 2013 | $1,955 | $32,869 | $6,640 | $26,229 |
Source: Public Records
Map
Nearby Homes
- 2788 Hazelton Ct
- 9852 Wiscasset Way
- 2792 Wheatfield Dr
- 10044 Crusader Dr
- 3215 Orangeburg Ct
- 10123 Manistee Way
- 3013 Niagara St
- 3099 Niagara St
- 2473 Schon Dr
- 3111 Niagara St
- 3123 Niagara St
- 10073 Pippin Rd
- 3252 Deshler Dr
- 10086 Windswept Ln
- 2626 Ontario St
- 3250 Springdale Rd
- 9978 Greenriver Dr
- 3261 Deshler Dr
- 9636 Pippin Rd
- 10220 Windswept Ln
- 9914 Crusader Dr
- 9900 Crusader Dr
- 9922 Crusader Dr
- 9894 Crusader Dr
- 9917 Dunraven Dr
- 9925 Dunraven Dr
- 9909 Dunraven Dr
- 9933 Dunraven Dr
- 9901 Dunraven Dr
- 9905 Crusader Dr
- 9928 Crusader Dr
- 9886 Crusader Dr
- 9911 Crusader Dr
- 9897 Crusader Dr
- 9919 Crusader Dr
- 9941 Dunraven Dr
- 9889 Crusader Dr
- 9893 Dunraven Dr
- 9925 Crusader Dr
- 9880 Crusader Dr
Your Personal Tour Guide
Ask me questions while you tour the home.