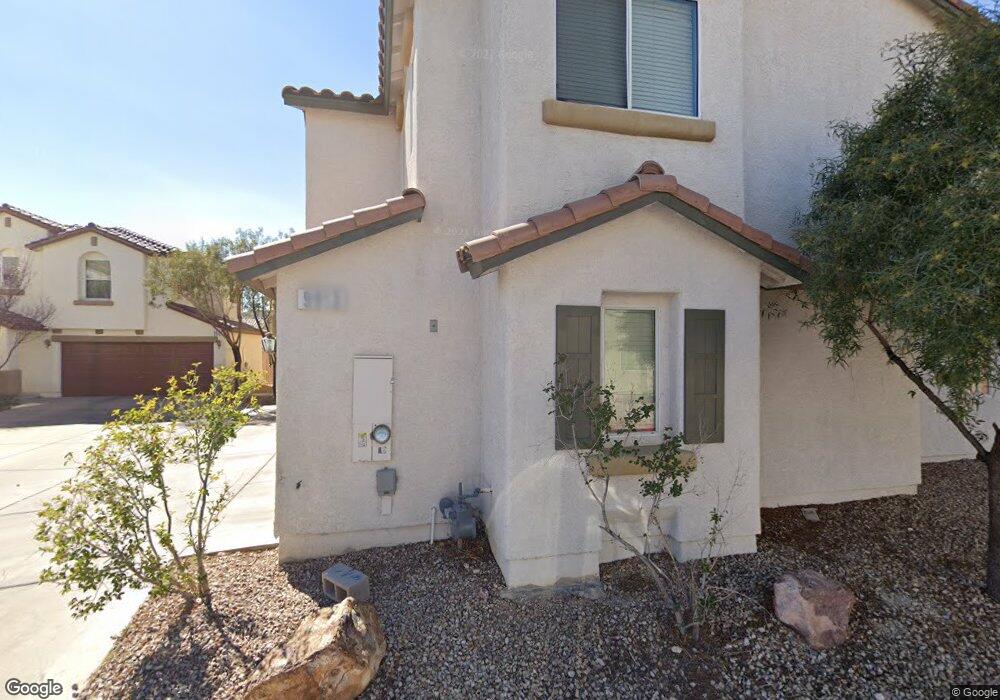
9909 Fife Lake Ct Las Vegas, NV 89148
Estimated Value: $367,000 - $396,000
3
Beds
3
Baths
1,417
Sq Ft
$271/Sq Ft
Est. Value
About This Home
This home is located at 9909 Fife Lake Ct, Las Vegas, NV 89148 and is currently estimated at $384,580, approximately $271 per square foot. 9909 Fife Lake Ct is a home located in Clark County with nearby schools including Shelley Berkley Elementary School, Wilbur & Theresa Faiss Middle School, and Sierra Vista High School.
Ownership History
Date
Name
Owned For
Owner Type
Purchase Details
Closed on
Oct 12, 2021
Sold by
Bush Margo L
Bought by
Bush Margo L and Margo L Bush Living Trust
Current Estimated Value
Purchase Details
Closed on
Aug 19, 2011
Sold by
Aurora Loan Services Llc
Bought by
Bush Margo L
Home Financials for this Owner
Home Financials are based on the most recent Mortgage that was taken out on this home.
Original Mortgage
$104,287
Outstanding Balance
$71,971
Interest Rate
4.5%
Mortgage Type
FHA
Estimated Equity
$312,609
Purchase Details
Closed on
Apr 21, 2011
Sold by
Majur Terrence J
Bought by
Aurora Loan Services Llc
Purchase Details
Closed on
Aug 25, 2005
Sold by
Richmond American Homes Of Nevada Inc
Bought by
Majur Terrence J
Home Financials for this Owner
Home Financials are based on the most recent Mortgage that was taken out on this home.
Original Mortgage
$233,800
Interest Rate
5.61%
Mortgage Type
Fannie Mae Freddie Mac
Create a Home Valuation Report for This Property
The Home Valuation Report is an in-depth analysis detailing your home's value as well as a comparison with similar homes in the area
Home Values in the Area
Average Home Value in this Area
Purchase History
| Date | Buyer | Sale Price | Title Company |
|---|---|---|---|
| Bush Margo L | -- | None Available | |
| Bush Margo L | $107,000 | Chicago Title The Pointe | |
| Aurora Loan Services Llc | $254,412 | Accommodation | |
| Majur Terrence J | $292,262 | Stewart Title Of Nevada |
Source: Public Records
Mortgage History
| Date | Status | Borrower | Loan Amount |
|---|---|---|---|
| Open | Bush Margo L | $104,287 | |
| Previous Owner | Majur Terrence J | $233,800 |
Source: Public Records
Tax History Compared to Growth
Tax History
| Year | Tax Paid | Tax Assessment Tax Assessment Total Assessment is a certain percentage of the fair market value that is determined by local assessors to be the total taxable value of land and additions on the property. | Land | Improvement |
|---|---|---|---|---|
| 2025 | $1,551 | $97,085 | $33,250 | $63,835 |
| 2024 | $1,436 | $97,085 | $33,250 | $63,835 |
| 2023 | $1,054 | $88,085 | $28,000 | $60,085 |
| 2022 | $1,330 | $76,489 | $21,700 | $54,789 |
| 2021 | $1,306 | $73,030 | $21,000 | $52,030 |
| 2020 | $1,193 | $71,811 | $20,300 | $51,511 |
| 2019 | $1,178 | $68,444 | $17,850 | $50,594 |
| 2018 | $1,125 | $62,402 | $14,000 | $48,402 |
| 2017 | $1,733 | $59,089 | $12,600 | $46,489 |
| 2016 | $1,054 | $52,857 | $9,800 | $43,057 |
| 2015 | $1,051 | $39,834 | $8,050 | $31,784 |
| 2014 | $1,020 | $33,738 | $4,550 | $29,188 |
Source: Public Records
Map
Nearby Homes
- 6449 Lake Scene St
- 10039 Pelham Park Ave
- 10093 Golden Bluff Ave
- 10056 Cranbrook Falls Ct
- 9899 Vista Meadows Ave
- 10113 Golden Bluff Ave Unit 3
- 9988 Regency Square Ave
- 9928 Regency Square Ave
- 10018 Regency Square Ave
- 9889 Gemstone Sunset Ave
- 6642 Titanium Crest St
- 6673 Titanium Crest St
- 10096 Amethyst Hills St
- 10131 Hollis Mountain Ave Unit 1
- 10160 Hollis Mountain Ave
- 6684 Regency Stone Way
- 6228 Windfresh Dr Unit 2
- 6294 Redstone Hills Dr
- 6722 Desert Crimson St
- 9987 Amethyst Hills St
- 9913 Fife Lake Ct
- 9917 Carrizo Springs Ave
- 9905 Fife Lake Ct
- 9925 Carrizo Springs Ave
- 9901 Fife Lake Ct
- 9921 Carrizo Springs Ave
- 9914 Fife Lake Ct
- 9929 Carrizo Springs Ave
- 9883 Bangalore Ct
- 9884 Chancery Ave
- 9933 Carrizo Springs Ave
- 9902 Fife Lake Ct
- 9902 Fife Lake Ct Unit none
- 9914 Copano Bay Ave
- 6425 Jewett Lake St
- 6425 Jewett Lake St Unit na
- 9918 Copano Bay Ave
- 9906 Copano Bay Ave
- 9877 Bangalore Ct
- 9910 Fife Lake Ct