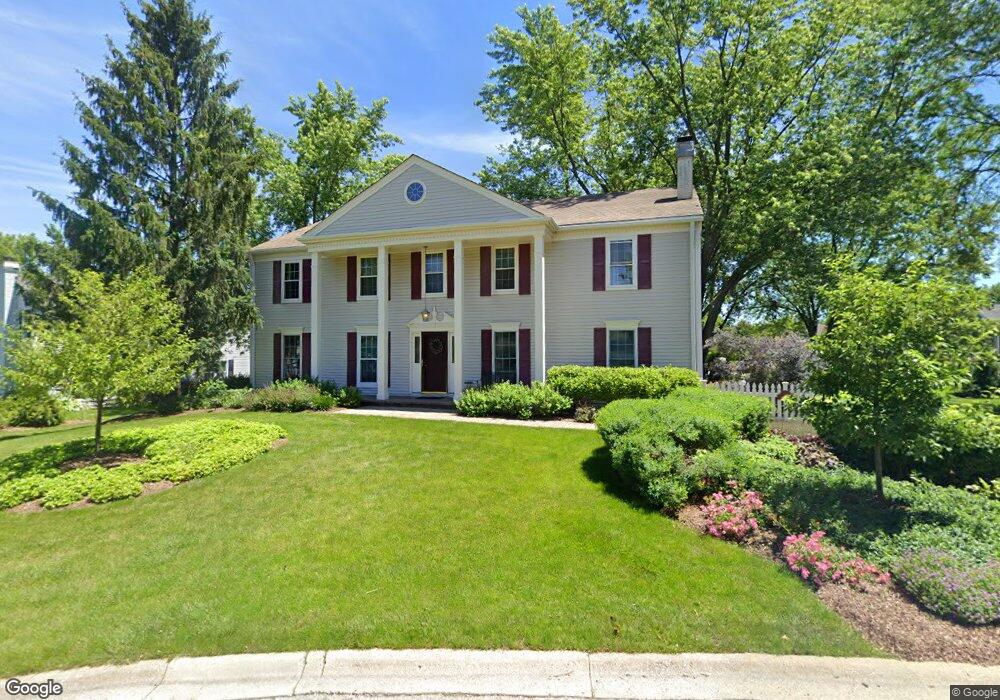
991 Commonwealth Ct Barrington, IL 60010
North Barrington Hills NeighborhoodEstimated Value: $605,233 - $630,000
--
Bed
4
Baths
2,604
Sq Ft
$239/Sq Ft
Est. Value
About This Home
This home is located at 991 Commonwealth Ct, Barrington, IL 60010 and is currently estimated at $622,058, approximately $238 per square foot. 991 Commonwealth Ct is a home located in Lake County with nearby schools including Roslyn Road Elementary School, Barrington Mdle School- Prairie Cmps, and Barrington High School.
Ownership History
Date
Name
Owned For
Owner Type
Purchase Details
Closed on
Aug 29, 2015
Sold by
Roberts Glen T and Roberts Mary C
Bought by
The Declaration Of Trust Mary Catherine
Current Estimated Value
Purchase Details
Closed on
Mar 27, 2002
Sold by
Roberts Mary C and Mary C Roberts Trust
Bought by
Roberts Glen T and Roberts Mary C
Home Financials for this Owner
Home Financials are based on the most recent Mortgage that was taken out on this home.
Original Mortgage
$141,982
Interest Rate
7.13%
Purchase Details
Closed on
Oct 30, 2001
Sold by
Roberts Glen T and Roberts Mary C
Bought by
Roberts Mary C and Declaration Of Trust Of Mary C
Purchase Details
Closed on
Jun 30, 1994
Sold by
Lasusa Lawrence R and Lasusa Barbara E
Bought by
Roberts Glen T and Roberts Mary C
Home Financials for this Owner
Home Financials are based on the most recent Mortgage that was taken out on this home.
Original Mortgage
$160,000
Interest Rate
7.5%
Create a Home Valuation Report for This Property
The Home Valuation Report is an in-depth analysis detailing your home's value as well as a comparison with similar homes in the area
Home Values in the Area
Average Home Value in this Area
Purchase History
| Date | Buyer | Sale Price | Title Company |
|---|---|---|---|
| The Declaration Of Trust Mary Catherine | -- | Attorney | |
| Roberts Glen T | -- | First American Title | |
| Roberts Mary C | -- | -- | |
| Roberts Glen T | $250,000 | -- |
Source: Public Records
Mortgage History
| Date | Status | Borrower | Loan Amount |
|---|---|---|---|
| Closed | Roberts Glen T | $141,982 | |
| Closed | Roberts Glen T | $160,000 |
Source: Public Records
Tax History Compared to Growth
Tax History
| Year | Tax Paid | Tax Assessment Tax Assessment Total Assessment is a certain percentage of the fair market value that is determined by local assessors to be the total taxable value of land and additions on the property. | Land | Improvement |
|---|---|---|---|---|
| 2024 | $11,196 | $167,364 | $39,786 | $127,578 |
| 2023 | $10,934 | $158,639 | $37,712 | $120,927 |
| 2022 | $10,934 | $150,096 | $42,665 | $107,431 |
| 2021 | $10,777 | $147,543 | $41,939 | $105,604 |
| 2020 | $10,493 | $147,087 | $41,809 | $105,278 |
| 2019 | $10,077 | $143,206 | $40,706 | $102,500 |
| 2018 | $10,899 | $151,930 | $39,511 | $112,419 |
| 2017 | $10,844 | $148,878 | $38,717 | $110,161 |
| 2016 | $10,690 | $143,263 | $37,257 | $106,006 |
| 2015 | $9,965 | $134,368 | $34,944 | $99,424 |
| 2014 | $9,214 | $119,005 | $33,608 | $85,397 |
| 2012 | $9,636 | $121,051 | $34,186 | $86,865 |
Source: Public Records
Map
Nearby Homes
- 709 Prospect Ave
- 520 Shorely Dr Unit 201
- 541 N Hough St Unit 205
- 565 Shorely Dr Unit 202
- 26225 W Merton Rd
- 26153 W Cuba Rd
- 25696 W Chatham Rd
- 26303 W Merton Rd
- 206 N Cook St
- 432 Whitney Dr
- 0 Illinois Route 59
- 215 N Hager Ave
- 136 Grant St
- 534 E Main St
- 148 W Station St
- 323 W Main St
- 126 W Lake St
- 248 Beverly Rd
- 440 W Main St
- 239 Beverly Rd
- 986 Hampton Park
- 989 Commonwealth Ct
- 995 Commonwealth Ct
- 993 Commonwealth Ct
- 984 Hampton Park
- 988 Hampton Park
- 987 Commonwealth Ct
- 997 Commonwealth Ct
- 982 Hampton Park
- 985 Commonwealth Ct
- 999 Commonwealth Ct
- 990 Hampton Park
- 990 Commonwealth Ct
- 994 Hampton Park
- 992 Commonwealth Ct
- 980 Hampton Park
- 250 Covington Dr
- 976 Hampton Park
- 998 Commonwealth Ct
- 280 Covington Dr