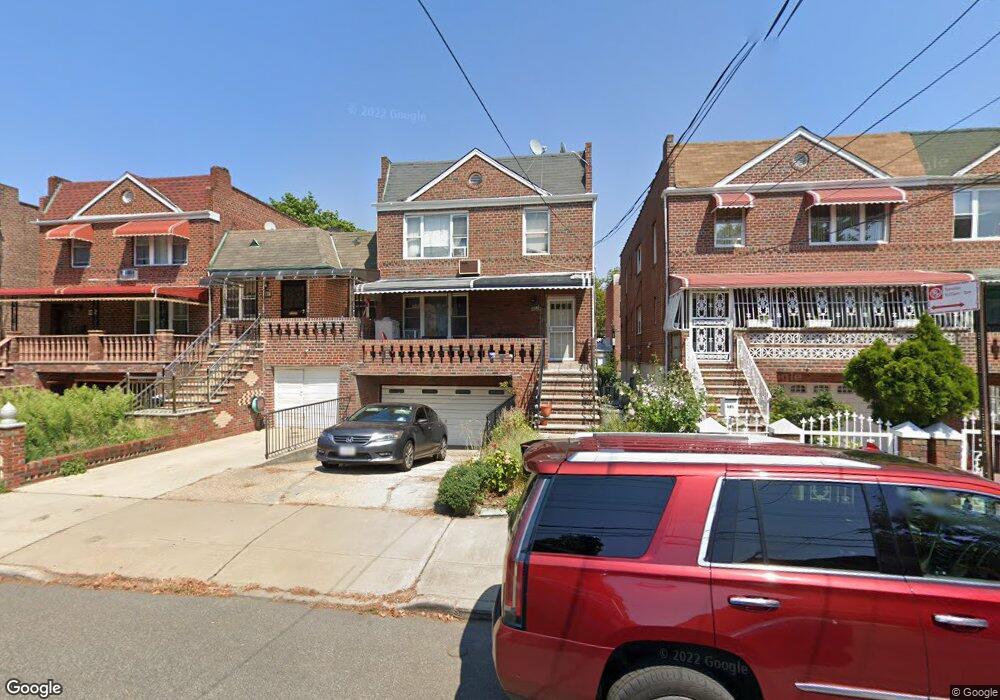
991 E 54th St Brooklyn, NY 11234
Flatlands NeighborhoodEstimated Value: $925,285 - $983,000
Studio
--
Bath
3,360
Sq Ft
$282/Sq Ft
Est. Value
About This Home
This home is located at 991 E 54th St, Brooklyn, NY 11234 and is currently estimated at $947,071, approximately $281 per square foot. 991 E 54th St is a home located in Kings County with nearby schools including Ebenezer Preparatory School and Great Oaks Elementary School.
Ownership History
Date
Name
Owned For
Owner Type
Purchase Details
Closed on
Jan 3, 2008
Sold by
Hinds Andrew and Hinds Dawn
Bought by
Hinds Dawn and Hinds Gregory
Current Estimated Value
Purchase Details
Closed on
Oct 2, 2000
Sold by
Hinds Andrew
Bought by
Hinds Andrew and Hinds Heather
Purchase Details
Closed on
Dec 16, 1999
Sold by
Alleyne Etwin
Bought by
Hinds Andrew and Hinds Heather
Home Financials for this Owner
Home Financials are based on the most recent Mortgage that was taken out on this home.
Original Mortgage
$278,800
Interest Rate
8.24%
Purchase Details
Closed on
Feb 27, 1995
Sold by
Walker Josline Cloyd
Bought by
Hinds Heather and Hinds Andrew
Home Financials for this Owner
Home Financials are based on the most recent Mortgage that was taken out on this home.
Original Mortgage
$212,400
Interest Rate
7.5%
Create a Home Valuation Report for This Property
The Home Valuation Report is an in-depth analysis detailing your home's value as well as a comparison with similar homes in the area
Home Values in the Area
Average Home Value in this Area
Purchase History
| Date | Buyer | Sale Price | Title Company |
|---|---|---|---|
| Hinds Dawn | -- | -- | |
| Hinds Dawn | -- | -- | |
| Hinds Andrew | -- | -- | |
| Hinds Andrew | -- | -- | |
| Hinds Andrew | -- | Commonwealth Land Title Ins | |
| Hinds Andrew | -- | Commonwealth Land Title Ins | |
| Hinds Heather | $236,000 | -- | |
| Hinds Heather | $236,000 | -- |
Source: Public Records
Mortgage History
| Date | Status | Borrower | Loan Amount |
|---|---|---|---|
| Previous Owner | Hinds Andrew | $278,800 | |
| Previous Owner | Hinds Heather | $212,400 |
Source: Public Records
Tax History
| Year | Tax Paid | Tax Assessment Tax Assessment Total Assessment is a certain percentage of the fair market value that is determined by local assessors to be the total taxable value of land and additions on the property. | Land | Improvement |
|---|---|---|---|---|
| 2025 | $9,846 | $61,620 | $11,400 | $50,220 |
| 2024 | $9,846 | $59,040 | $11,400 | $47,640 |
| 2023 | $9,376 | $61,320 | $11,400 | $49,920 |
| 2022 | $8,671 | $59,220 | $11,400 | $47,820 |
| 2021 | $8,614 | $64,980 | $11,400 | $53,580 |
| 2020 | $4,281 | $50,040 | $11,400 | $38,640 |
| 2019 | $8,497 | $50,040 | $11,400 | $38,640 |
| 2018 | $7,783 | $39,639 | $9,030 | $30,609 |
| 2017 | $7,324 | $37,396 | $9,563 | $27,833 |
| 2016 | $6,743 | $35,280 | $11,400 | $23,880 |
| 2015 | $4,209 | $36,720 | $11,245 | $25,475 |
| 2014 | $4,209 | $36,444 | $11,161 | $25,283 |
Source: Public Records
Map
Nearby Homes
- 5415 Glenwood Rd
- 1155 E 52nd St
- 904 E 54th St
- 833 E 56th St
- 825 E 57th St
- 997 E 52nd St
- 1140 E 53rd St
- 1144 E 53rd St
- 827 E 55th St
- 673 E 57th St
- 5514 Avenue I
- 1226 E 51st St
- 655 E 57th St
- 742 E 58th St
- 1199 E 53rd St Unit 3O
- 1199 E 53rd St Unit 1D
- 1199 E 53rd St Unit 1L
- 1199 E 53rd St Unit 2X
- 1199 E 53rd St Unit 7L
- 1199 E 53rd St Unit 5C
Your Personal Tour Guide
Ask me questions while you tour the home.