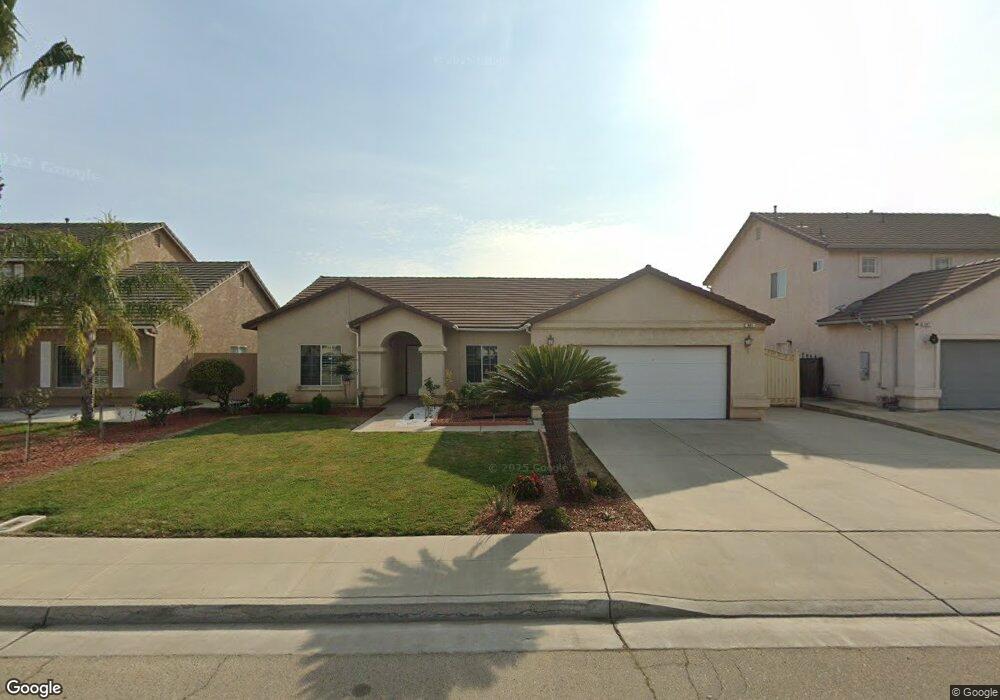
991 Maple Ave Fowler, CA 93625
Estimated Value: $423,000 - $500,000
4
Beds
2
Baths
2,095
Sq Ft
$219/Sq Ft
Est. Value
About This Home
This home is located at 991 Maple Ave, Fowler, CA 93625 and is currently estimated at $458,111, approximately $218 per square foot. 991 Maple Ave is a home located in Fresno County with nearby schools including Fremont Elementary School, Marshall Elementary School, and John Sutter Middle School.
Ownership History
Date
Name
Owned For
Owner Type
Purchase Details
Closed on
Feb 14, 2024
Sold by
Pandher Family Trust
Bought by
Singh Mand Gopal and Singh Devinder Kaur
Current Estimated Value
Purchase Details
Closed on
Jun 28, 2022
Sold by
Singh Pandher Tara and Singh Nachhattar
Bought by
Pandher Family Trust
Purchase Details
Closed on
Oct 16, 2007
Sold by
Pandher Tara S
Bought by
Pandher Tara S and Kaur Nachhattar
Purchase Details
Closed on
Aug 29, 2003
Sold by
Kaur Nachhattar
Bought by
Pandher Tara S
Home Financials for this Owner
Home Financials are based on the most recent Mortgage that was taken out on this home.
Original Mortgage
$144,915
Interest Rate
5.2%
Mortgage Type
Purchase Money Mortgage
Purchase Details
Closed on
Aug 22, 2003
Sold by
West Star Construction Inc
Bought by
Pandher Tara S
Home Financials for this Owner
Home Financials are based on the most recent Mortgage that was taken out on this home.
Original Mortgage
$144,915
Interest Rate
5.2%
Mortgage Type
Purchase Money Mortgage
Create a Home Valuation Report for This Property
The Home Valuation Report is an in-depth analysis detailing your home's value as well as a comparison with similar homes in the area
Home Values in the Area
Average Home Value in this Area
Purchase History
| Date | Buyer | Sale Price | Title Company |
|---|---|---|---|
| Singh Mand Gopal | $312,000 | Old Republic Title Company | |
| Pandher Family Trust | -- | Fennemore Dowling Aaron | |
| Pandher Tara S | -- | None Available | |
| Pandher Tara S | -- | Chicago Title Company | |
| Pandher Tara S | $181,500 | Chicago Title Company |
Source: Public Records
Mortgage History
| Date | Status | Borrower | Loan Amount |
|---|---|---|---|
| Previous Owner | Pandher Tara S | $144,915 |
Source: Public Records
Tax History
| Year | Tax Paid | Tax Assessment Tax Assessment Total Assessment is a certain percentage of the fair market value that is determined by local assessors to be the total taxable value of land and additions on the property. | Land | Improvement |
|---|---|---|---|---|
| 2025 | $5,860 | $448,800 | $102,000 | $346,800 |
| 2023 | $3,280 | $250,747 | $47,821 | $202,926 |
| 2022 | $3,222 | $245,832 | $46,884 | $198,948 |
| 2021 | $3,140 | $241,013 | $45,965 | $195,048 |
| 2020 | $3,115 | $238,543 | $45,494 | $193,049 |
| 2019 | $3,088 | $233,866 | $44,602 | $189,264 |
| 2018 | $3,035 | $229,281 | $43,728 | $185,553 |
| 2017 | $2,956 | $224,786 | $42,871 | $181,915 |
| 2016 | $2,683 | $220,380 | $42,031 | $178,349 |
| 2015 | $2,683 | $217,071 | $41,400 | $175,671 |
| 2014 | $2,562 | $207,800 | $47,500 | $160,300 |
Source: Public Records
Map
Nearby Homes
- 1002 Sequoia Ct
- 1002 Lucia Ave
- 1001 Lucia Ave
- 924 Palm Ave
- 1015 Lucia Ave
- 745 Esraelian Ave
- 118 N 9th St
- 736 Carey Ave
- 969 S Kandarian Ct
- 1146 W Walter Ave Unit 50
- 217 S 7th St
- 873 S Philip Ave
- 858 S Philip Ave
- 1451 W Ryan Ave
- 906 S Philip Ave
- 922 S Philip Ave
- 325 N 7th St
- 8353 S Fowler Ave
- 430 S 6th St
- 413 S 5th St
Your Personal Tour Guide
Ask me questions while you tour the home.