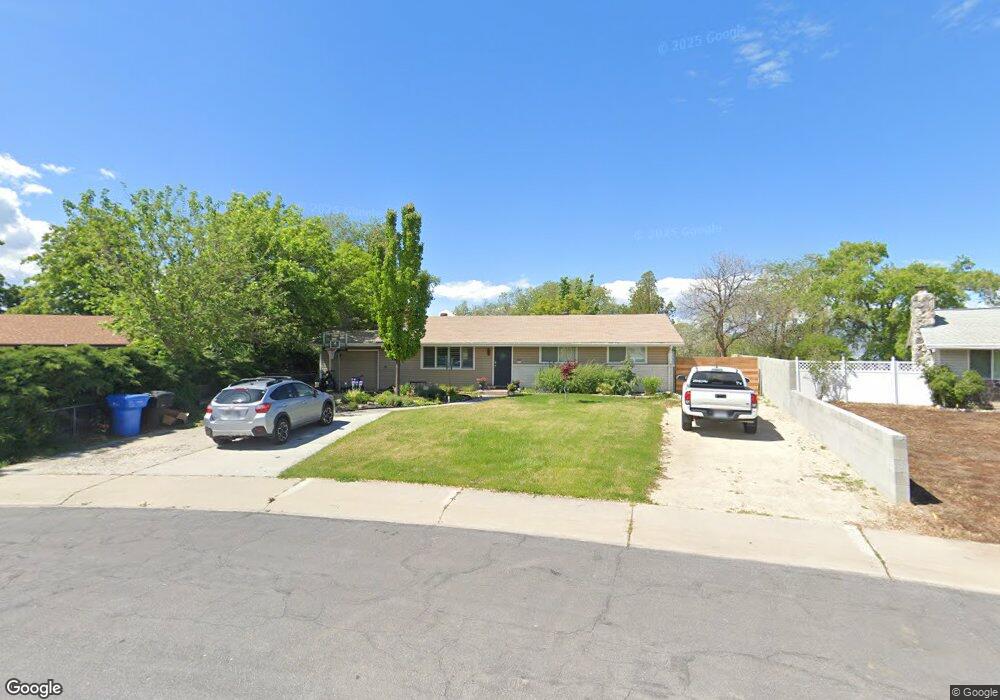
991 W 280 N Orem, UT 84057
Suncrest NeighborhoodEstimated Value: $466,000 - $639,940
4
Beds
3
Baths
1,590
Sq Ft
$367/Sq Ft
Est. Value
About This Home
This home is located at 991 W 280 N, Orem, UT 84057 and is currently estimated at $583,485, approximately $366 per square foot. 991 W 280 N is a home located in Utah County with nearby schools including Orem Junior High School, Mountain View High School, and Franklin Discovery Academy.
Ownership History
Date
Name
Owned For
Owner Type
Purchase Details
Closed on
Feb 9, 2024
Sold by
Kennedy Jason A
Bought by
Kennedy Jason A and Kennedy Cori W
Current Estimated Value
Home Financials for this Owner
Home Financials are based on the most recent Mortgage that was taken out on this home.
Original Mortgage
$215,000
Outstanding Balance
$199,358
Interest Rate
5.89%
Mortgage Type
New Conventional
Estimated Equity
$384,127
Purchase Details
Closed on
Feb 26, 2014
Sold by
Allredge Jacob C
Bought by
Kennedy Jason A and Kennedy Cori W
Home Financials for this Owner
Home Financials are based on the most recent Mortgage that was taken out on this home.
Original Mortgage
$184,594
Interest Rate
4.75%
Mortgage Type
FHA
Purchase Details
Closed on
Oct 27, 2010
Sold by
Gorringe Barry L
Bought by
Alldredge Jacob C
Purchase Details
Closed on
Feb 16, 1999
Sold by
Lindley Ronald Aaron
Bought by
Estate Of Michael Paul Lindley
Home Financials for this Owner
Home Financials are based on the most recent Mortgage that was taken out on this home.
Original Mortgage
$88,350
Interest Rate
6.78%
Purchase Details
Closed on
Feb 15, 1999
Sold by
Firmage Lindley Michael F and Firmage Lindley William
Bought by
Kelly John and Kelly Luz
Home Financials for this Owner
Home Financials are based on the most recent Mortgage that was taken out on this home.
Original Mortgage
$88,350
Interest Rate
6.78%
Create a Home Valuation Report for This Property
The Home Valuation Report is an in-depth analysis detailing your home's value as well as a comparison with similar homes in the area
Home Values in the Area
Average Home Value in this Area
Purchase History
| Date | Buyer | Sale Price | Title Company |
|---|---|---|---|
| Kennedy Jason A | -- | Old Republic Title | |
| Kennedy Jason A | -- | Old Republic Title | |
| Kennedy Jason A | -- | First American Title Co Llc | |
| Alldredge Jacob C | -- | Keystone Title Insurance Ag | |
| Estate Of Michael Paul Lindley | -- | Empire Land Title Company | |
| Firmage Lindley Michael F | -- | Empire Land Title Company | |
| Kelly John | -- | Empire Land Title Company | |
| Estate Of Michael Paul Lindley | -- | Empire Land Title Company | |
| Estate Of Michael Paul Lindley | -- | Empire Land Title Company | |
| Estate Of Michael Paul Lindley | -- | Empire Land Title Company |
Source: Public Records
Mortgage History
| Date | Status | Borrower | Loan Amount |
|---|---|---|---|
| Open | Kennedy Jason A | $215,000 | |
| Previous Owner | Kennedy Jason A | $184,594 | |
| Previous Owner | Kelly John | $88,350 |
Source: Public Records
Tax History
| Year | Tax Paid | Tax Assessment Tax Assessment Total Assessment is a certain percentage of the fair market value that is determined by local assessors to be the total taxable value of land and additions on the property. | Land | Improvement |
|---|---|---|---|---|
| 2025 | $1,885 | $576,400 | $226,100 | $350,300 |
| 2024 | $1,885 | $230,450 | $0 | $0 |
| 2023 | $1,721 | $226,215 | $0 | $0 |
| 2022 | $1,804 | $229,680 | $0 | $0 |
| 2021 | $1,603 | $309,200 | $135,000 | $174,200 |
| 2020 | $1,462 | $277,100 | $108,000 | $169,100 |
| 2019 | $1,294 | $255,000 | $108,000 | $147,000 |
| 2018 | $1,208 | $227,500 | $99,700 | $127,800 |
| 2017 | $1,126 | $113,630 | $0 | $0 |
| 2016 | $1,093 | $101,640 | $0 | $0 |
| 2015 | $1,102 | $96,965 | $0 | $0 |
| 2014 | $1,004 | $87,945 | $0 | $0 |
Source: Public Records
Map
Nearby Homes
- 222 N 1200 W Unit 144
- 222 N 1200 W Unit 53
- 222 N 1200 W Unit 84
- 1094 W 465 N
- 45 N 970 W
- 510 N 940 W
- 454 N 1235 W
- 875 W 530 N
- 896 W 30 S
- 1058 W 570 St N
- 489 N Beverly Ave
- 474 N Emery Ave
- 954 W 630 N Unit 34,
- 557 N Emery Ave
- 155 S 1200 W Unit 69
- 155 S 1200 W Unit 6
- 155 S 1200 W Unit 97
- 776 W 640 N
- 574 N 600 W
- 237 S Ridgeview Dr
Your Personal Tour Guide
Ask me questions while you tour the home.