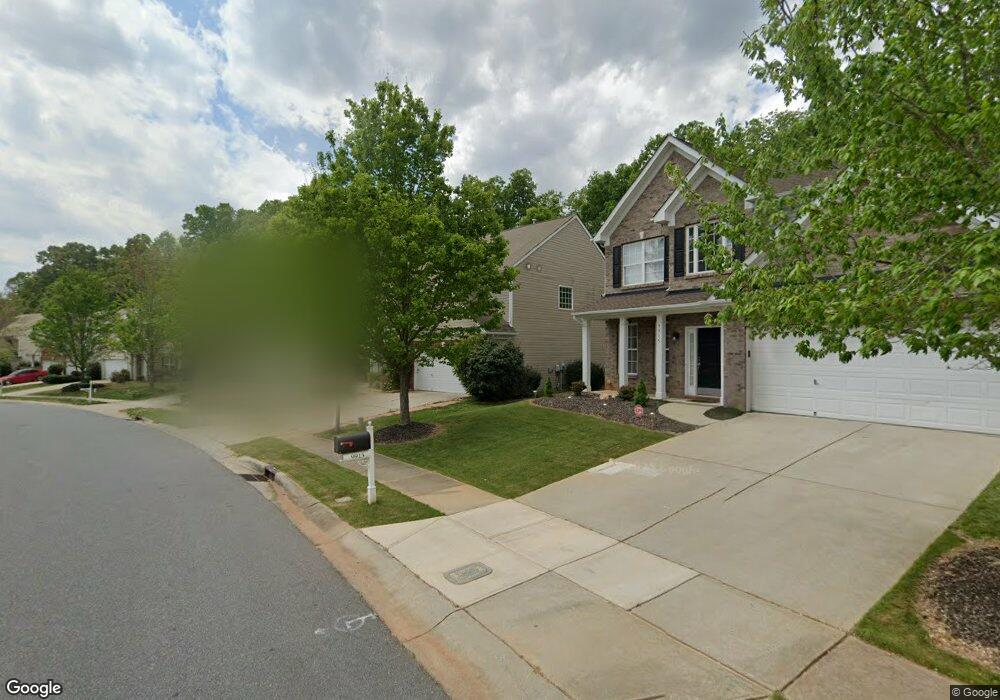
9911 Jeanette Cir Unit 83 Charlotte, NC 28213
Back Creek Church Road NeighborhoodEstimated Value: $420,000 - $495,000
3
Beds
3
Baths
2,804
Sq Ft
$159/Sq Ft
Est. Value
About This Home
This home is located at 9911 Jeanette Cir Unit 83, Charlotte, NC 28213 and is currently estimated at $446,837, approximately $159 per square foot. 9911 Jeanette Cir Unit 83 is a home located in Mecklenburg County with nearby schools including University Meadows Elementary, James Martin Middle, and Julius L. Chambers High School.
Ownership History
Date
Name
Owned For
Owner Type
Purchase Details
Closed on
Jul 18, 2016
Sold by
Chandhok Arun K
Bought by
Chandhok Arun K and Chandhok Veena
Current Estimated Value
Home Financials for this Owner
Home Financials are based on the most recent Mortgage that was taken out on this home.
Original Mortgage
$115,000
Outstanding Balance
$92,041
Interest Rate
3.66%
Mortgage Type
New Conventional
Estimated Equity
$354,796
Purchase Details
Closed on
May 27, 2004
Sold by
Mdc Homes Charlotte Llc
Bought by
Battey Kevin and Battey Sherry I
Home Financials for this Owner
Home Financials are based on the most recent Mortgage that was taken out on this home.
Original Mortgage
$147,608
Interest Rate
5.88%
Mortgage Type
Purchase Money Mortgage
Purchase Details
Closed on
Feb 4, 2004
Sold by
Fc Caldwell Llc
Bought by
Mdc Homes Charlotte Llc
Create a Home Valuation Report for This Property
The Home Valuation Report is an in-depth analysis detailing your home's value as well as a comparison with similar homes in the area
Home Values in the Area
Average Home Value in this Area
Purchase History
| Date | Buyer | Sale Price | Title Company |
|---|---|---|---|
| Chandhok Arun K | -- | None Available | |
| Chandok Arun K | $213,500 | None Available | |
| Battey Kevin | $185,000 | -- | |
| Mdc Homes Charlotte Llc | $670,000 | -- |
Source: Public Records
Mortgage History
| Date | Status | Borrower | Loan Amount |
|---|---|---|---|
| Open | Chandhok Arun K | $115,000 | |
| Previous Owner | Battey Kevin | $147,608 | |
| Closed | Battey Kevin | $36,902 |
Source: Public Records
Tax History Compared to Growth
Tax History
| Year | Tax Paid | Tax Assessment Tax Assessment Total Assessment is a certain percentage of the fair market value that is determined by local assessors to be the total taxable value of land and additions on the property. | Land | Improvement |
|---|---|---|---|---|
| 2025 | $3,316 | $417,700 | $100,000 | $317,700 |
| 2024 | $3,316 | $417,700 | $100,000 | $317,700 |
| 2023 | $3,203 | $417,700 | $100,000 | $317,700 |
| 2022 | $2,514 | $247,500 | $45,000 | $202,500 |
| 2021 | $2,503 | $247,500 | $45,000 | $202,500 |
| 2020 | $2,496 | $246,800 | $45,000 | $201,800 |
| 2019 | $2,473 | $246,800 | $45,000 | $201,800 |
| 2018 | $2,377 | $175,600 | $36,000 | $139,600 |
| 2017 | $2,336 | $175,600 | $36,000 | $139,600 |
| 2016 | $2,326 | $175,600 | $36,000 | $139,600 |
| 2015 | $2,315 | $175,600 | $36,000 | $139,600 |
| 2014 | $2,317 | $0 | $0 | $0 |
Source: Public Records
Map
Nearby Homes
- 11414 Sidney Crest Ave
- 16737 Winston Oaks Ct
- 11412 Celandine Ct
- 4036 Sawmill Trace Dr
- 12822 Plumleaf Dr
- 10305 Flat Stone Rd
- 3135 Falling Rock Ct
- 3107 Falling Rock Ct
- 2632 Yarrow Rd
- 3040 Five Creek Rd
- 3040 Five Creek Rd Unit 39
- 3044 Five Creek Rd
- 3044 Five Creek Rd Unit 38
- 3048 Five Creek Rd
- 3048 Five Creek Rd Unit 37
- 3060 Five Creek Rd
- 3060 Five Creek Rd Unit 34
- 10804 Maryanna Ct
- 2529 Woodsorrel Ln
- 10048 Greystar Ln
- 9911 Jeanette Cir
- 9907 Jeanette Cir
- 9915 Jeanette Cir
- 9903 Jeanette Cir
- 9919 Jeanette Cir
- 9843 Jeanette Cir
- 9912 Jeanette Cir
- 9912 Jeanette Cir Unit L73
- 9906 Jeanette Cir
- 9906 Jeanette Cir Unit 59,72
- 9918 Jeanette Cir
- 9923 Jeanette Cir
- 9900 Jeanette Cir
- 9839 Jeanette Cir
- 9924 Jeanette Cir
- 9927 Jeanette Cir
- 11601 Erwin Ridge Ave
- 9840 Jeanette Cir
- 11531 Erwin Ridge Ave
- 11605 Erwin Ridge Ave