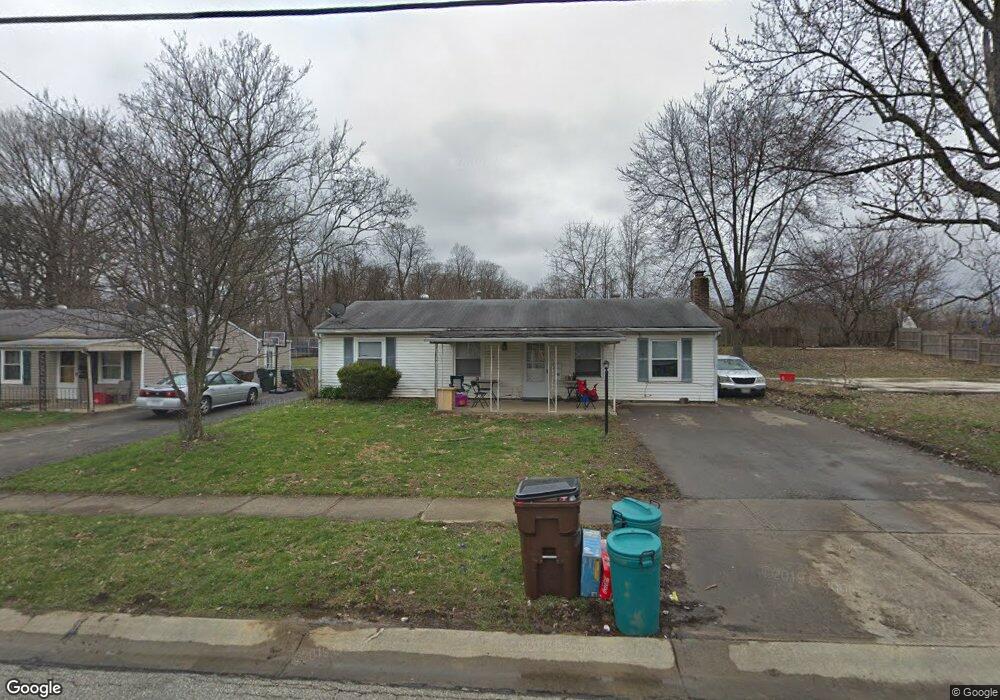
9911 Marino Dr Cincinnati, OH 45251
Estimated Value: $145,000 - $179,000
4
Beds
1
Bath
1,168
Sq Ft
$139/Sq Ft
Est. Value
About This Home
This home is located at 9911 Marino Dr, Cincinnati, OH 45251 and is currently estimated at $162,172, approximately $138 per square foot. 9911 Marino Dr is a home located in Hamilton County with nearby schools including Taylor Elementary School, Pleasant Run Elementary School, and Pleasant Run Middle School.
Ownership History
Date
Name
Owned For
Owner Type
Purchase Details
Closed on
Sep 22, 2015
Sold by
Klein Greg J and Klein Nancy R
Bought by
Marino Holdings Llc
Current Estimated Value
Purchase Details
Closed on
Dec 31, 2014
Sold by
Keller & Klein Ltd
Bought by
Klein Greg J
Purchase Details
Closed on
Jan 22, 2009
Sold by
Secretary Of Housing & Urban Development
Bought by
Keller & Klein Ltd
Purchase Details
Closed on
Jun 24, 2008
Sold by
Mckay David M
Bought by
Secretary Of Housing & Urban Development
Purchase Details
Closed on
Feb 28, 2005
Sold by
Phelps Randy L and Phelps Marcie A
Bought by
Mckay David M
Purchase Details
Closed on
Sep 14, 2001
Sold by
Orr Vickie
Bought by
Phelps Randy L and Phelps Marcie A
Purchase Details
Closed on
Feb 26, 2001
Sold by
Phelps Randy
Bought by
Orr Vickie
Purchase Details
Closed on
Jul 3, 1998
Sold by
Phelps Verlon
Bought by
Phelps Verlon and Phelps Randy
Create a Home Valuation Report for This Property
The Home Valuation Report is an in-depth analysis detailing your home's value as well as a comparison with similar homes in the area
Home Values in the Area
Average Home Value in this Area
Purchase History
| Date | Buyer | Sale Price | Title Company |
|---|---|---|---|
| Marino Holdings Llc | -- | Attorney | |
| Klein Greg J | -- | Attorney | |
| Keller & Klein Ltd | $30,000 | Commitment Title Agency Inc | |
| Secretary Of Housing & Urban Development | $50,000 | None Available | |
| Mckay David M | $92,000 | None Available | |
| Phelps Randy L | $64,000 | -- | |
| Orr Vickie | $67,600 | -- | |
| Phelps Verlon | -- | -- |
Source: Public Records
Tax History Compared to Growth
Tax History
| Year | Tax Paid | Tax Assessment Tax Assessment Total Assessment is a certain percentage of the fair market value that is determined by local assessors to be the total taxable value of land and additions on the property. | Land | Improvement |
|---|---|---|---|---|
| 2024 | $1,700 | $30,093 | $8,694 | $21,399 |
| 2023 | $1,680 | $30,093 | $8,694 | $21,399 |
| 2022 | $1,284 | $18,753 | $7,665 | $11,088 |
| 2021 | $1,296 | $18,753 | $7,665 | $11,088 |
| 2020 | $1,281 | $18,753 | $7,665 | $11,088 |
| 2019 | $1,114 | $15,124 | $6,181 | $8,943 |
| 2018 | $1,003 | $15,124 | $6,181 | $8,943 |
| 2017 | $964 | $15,124 | $6,181 | $8,943 |
| 2016 | $656 | $9,976 | $6,241 | $3,735 |
| 2015 | $653 | $9,976 | $6,241 | $3,735 |
| 2014 | $655 | $9,976 | $6,241 | $3,735 |
| 2013 | $658 | $10,501 | $6,570 | $3,931 |
Source: Public Records
Map
Nearby Homes
- 9974 Marino Dr
- 9828 Loralinda Dr
- 9977 Dunraven Dr
- 2788 Hazelton Ct
- 9738 Gibralter Dr
- 9717 Loralinda Dr
- 9737 Dunraven Dr
- 3013 Niagara St
- 3244 Springdale Rd
- 3246 Ainsworth Dr
- 3276 Deshler Dr
- 9712 Manhattan Dr
- 3275 Deshler Dr
- 10229 Storm Dr
- 2592 Wenning Rd
- 10226 Springknob Ct
- 10229 Crestland Ct
- 9562 Trafalgar Ct
- 10221 Crestland Ct
- 3351 Deshler Dr
- 9903 Marino Dr
- 9919 Marino Dr
- 9895 Marino Dr
- 9927 Marino Dr
- 9912 Marino Dr
- 9887 Marino Dr
- 9935 Marino Dr
- 9920 Marino Dr
- 9904 Marino Dr
- 9928 Marino Dr
- 9896 Marino Dr
- 9879 Marino Dr
- 9943 Marino Dr
- 9936 Marino Dr
- 9888 Marino Dr
- 9871 Marino Dr
- 9905 Crusader Dr
- 3037 Wheatfield Dr
- 9949 Marino Dr
- 9880 Marino Dr