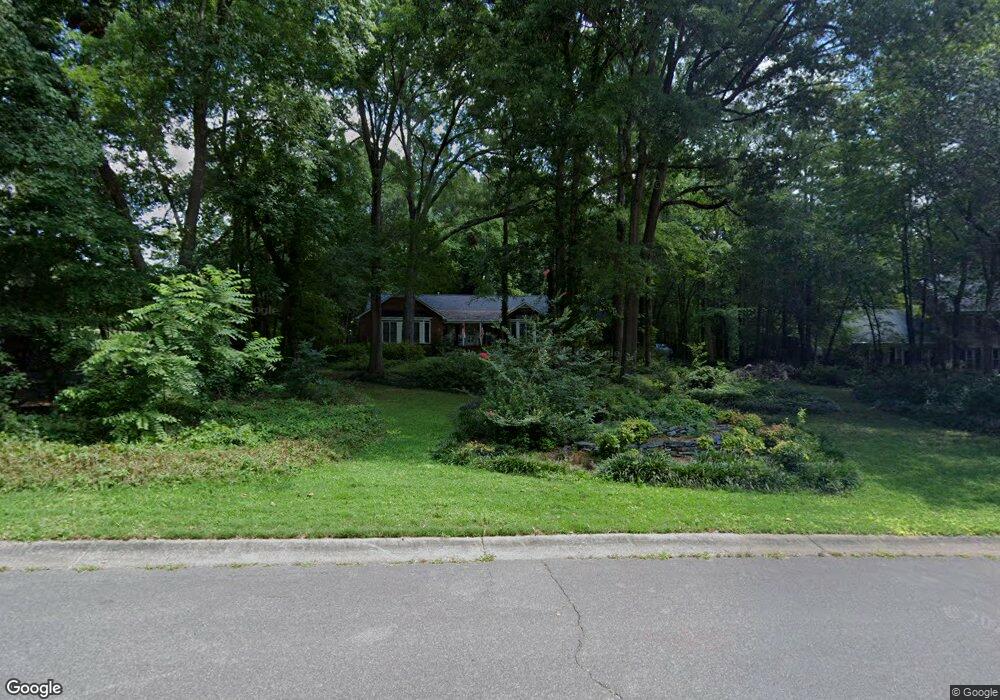
9911 Spring Harvest Dr Mint Hill, NC 28227
Estimated Value: $568,000 - $656,000
4
Beds
3
Baths
2,809
Sq Ft
$215/Sq Ft
Est. Value
About This Home
This home is located at 9911 Spring Harvest Dr, Mint Hill, NC 28227 and is currently estimated at $605,273, approximately $215 per square foot. 9911 Spring Harvest Dr is a home located in Mecklenburg County with nearby schools including Northeast Middle, Independence High, and Matthews Christian Academy.
Ownership History
Date
Name
Owned For
Owner Type
Purchase Details
Closed on
May 28, 2019
Sold by
Allen R Michael
Bought by
Nichols Chavous Elmarice
Current Estimated Value
Home Financials for this Owner
Home Financials are based on the most recent Mortgage that was taken out on this home.
Original Mortgage
$267,800
Outstanding Balance
$238,974
Interest Rate
4.87%
Mortgage Type
Adjustable Rate Mortgage/ARM
Estimated Equity
$366,299
Purchase Details
Closed on
Jan 8, 2016
Sold by
Hunter Jenna Shirey and Hunter Adam Douglas Cole
Bought by
Allen R Michael and Estate Of Yacine Moudarrir
Purchase Details
Closed on
Oct 18, 2012
Sold by
Towley Rod M
Bought by
Shirey Jenna C
Purchase Details
Closed on
Nov 3, 2005
Sold by
Klipstein Truman R and Messer Doris
Bought by
Townley Rod M
Home Financials for this Owner
Home Financials are based on the most recent Mortgage that was taken out on this home.
Original Mortgage
$215,920
Interest Rate
5.76%
Mortgage Type
Fannie Mae Freddie Mac
Create a Home Valuation Report for This Property
The Home Valuation Report is an in-depth analysis detailing your home's value as well as a comparison with similar homes in the area
Home Values in the Area
Average Home Value in this Area
Purchase History
| Date | Buyer | Sale Price | Title Company |
|---|---|---|---|
| Nichols Chavous Elmarice | $267,800 | None Available | |
| Allen R Michael | -- | None Available | |
| Shirey Jenna C | $260,000 | None Available | |
| Townley Rod M | $270,000 | Investors Title |
Source: Public Records
Mortgage History
| Date | Status | Borrower | Loan Amount |
|---|---|---|---|
| Open | Nichols Chavous Elmarice | $267,800 | |
| Previous Owner | Townley Rod M | $215,920 |
Source: Public Records
Tax History Compared to Growth
Tax History
| Year | Tax Paid | Tax Assessment Tax Assessment Total Assessment is a certain percentage of the fair market value that is determined by local assessors to be the total taxable value of land and additions on the property. | Land | Improvement |
|---|---|---|---|---|
| 2025 | $3,637 | $506,700 | $110,000 | $396,700 |
| 2024 | $3,637 | $506,700 | $110,000 | $396,700 |
| 2023 | $3,582 | $506,700 | $110,000 | $396,700 |
| 2022 | $3,338 | $378,300 | $90,000 | $288,300 |
| 2021 | $3,338 | $378,300 | $90,000 | $288,300 |
| 2020 | $3,338 | $378,300 | $90,000 | $288,300 |
| 2019 | $3,332 | $378,300 | $90,000 | $288,300 |
| 2018 | $3,032 | $258,900 | $37,500 | $221,400 |
| 2017 | $2,835 | $258,900 | $37,500 | $221,400 |
| 2016 | $2,831 | $258,900 | $37,500 | $221,400 |
| 2015 | $2,828 | $258,900 | $37,500 | $221,400 |
| 2014 | $3,238 | $296,900 | $50,000 | $246,900 |
Source: Public Records
Map
Nearby Homes
- 9830 Spring Harvest Dr
- 6421 Gold Wagon Ln
- 3220 Jonesberry Rd
- 4716 Margaret Wallace Rd
- 9909 Idlewild Rd
- 10003 Idlewild Rd
- 3708 Martele Dr
- 7201 Stillwell Rd
- 7125 Stillwell Rd
- 7601 Swedish Ivy Ln
- 10425 Idlewild Rd
- 5448 Wyalong Dr
- 4240 Bathurst Dr
- 9919 Treeside Ln
- 6001 Gold Wagon Ln
- 8318 David Lee Ln
- 10437 Idlewild Rd
- 3602 Melrose Cottage Dr
- 4220 Melrose Club Dr
- 3657 Melrose Cottage Dr
- 9921 Spring Harvest Dr
- 6721 Gold Wagon Ln
- 6711 Gold Wagon Ln
- 6533 Gold Wagon Ln
- 9925 Spring Harvest Dr
- 6601 Gold Wagon Ln
- 6521 Gold Wagon Ln
- 6609 Gold Wagon Ln
- 6701 Gold Wagon Ln
- 6511 Gold Wagon Ln
- 9912 Spring Harvest Dr
- 9900 Spring Harvest Dr
- 9922 Spring Harvest Dr
- 6501 Gold Wagon Ln
- 6720 Gold Wagon Ln
- 9831 Spring Harvest Dr
- 6730 Gold Wagon Ln
- 9840 Spring Harvest Dr
- 6710 Gold Wagon Ln
- 9929 Spring Harvest Dr