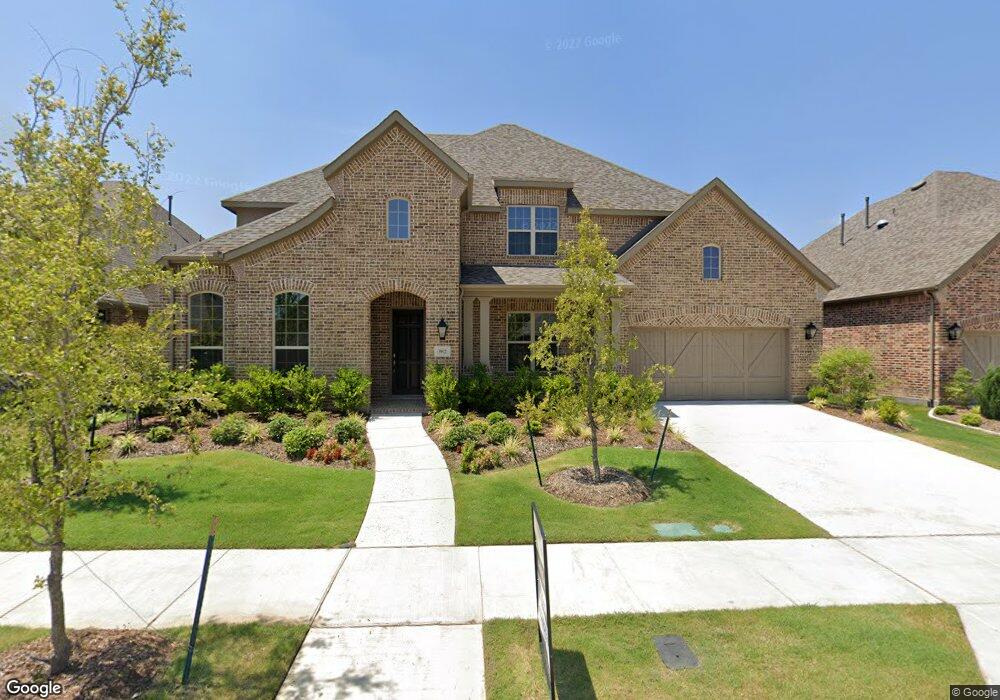
9912 Peninsula Point Little Elm, TX 75068
Estimated Value: $680,000 - $733,000
4
Beds
4
Baths
3,726
Sq Ft
$189/Sq Ft
Est. Value
About This Home
This home is located at 9912 Peninsula Point, Little Elm, TX 75068 and is currently estimated at $703,582, approximately $188 per square foot. 9912 Peninsula Point is a home located in Denton County with nearby schools including Oak Point Elementary School, Jerry R. Walker Middle School, and Little Elm High School.
Ownership History
Date
Name
Owned For
Owner Type
Purchase Details
Closed on
Jun 18, 2021
Sold by
Earnest Buyers Llc
Bought by
Robinson Louis and Bejgrowicz Vivian
Current Estimated Value
Home Financials for this Owner
Home Financials are based on the most recent Mortgage that was taken out on this home.
Original Mortgage
$448,000
Outstanding Balance
$405,608
Interest Rate
2.9%
Mortgage Type
New Conventional
Estimated Equity
$297,974
Purchase Details
Closed on
Dec 2, 2020
Sold by
Rodgers Lance and Rodgers Tabitha
Bought by
Earnest Buyers Llc
Purchase Details
Closed on
Sep 27, 2018
Sold by
Highland Homes Dalls Llc
Bought by
Rodgers Lance L
Home Financials for this Owner
Home Financials are based on the most recent Mortgage that was taken out on this home.
Original Mortgage
$393,162
Interest Rate
4.5%
Mortgage Type
FHA
Create a Home Valuation Report for This Property
The Home Valuation Report is an in-depth analysis detailing your home's value as well as a comparison with similar homes in the area
Home Values in the Area
Average Home Value in this Area
Purchase History
| Date | Buyer | Sale Price | Title Company |
|---|---|---|---|
| Robinson Louis | -- | Lawyers Title | |
| Robinson Louis | -- | Lawyers Title | |
| Earnest Buyers Llc | -- | None Listed On Document | |
| Rodgers Lance L | -- | Old Republic National Title |
Source: Public Records
Mortgage History
| Date | Status | Borrower | Loan Amount |
|---|---|---|---|
| Open | Robinson Louis | $448,000 | |
| Closed | Robinson Louis | $448,000 | |
| Previous Owner | Rodgers Lance L | $393,162 |
Source: Public Records
Tax History Compared to Growth
Tax History
| Year | Tax Paid | Tax Assessment Tax Assessment Total Assessment is a certain percentage of the fair market value that is determined by local assessors to be the total taxable value of land and additions on the property. | Land | Improvement |
|---|---|---|---|---|
| 2025 | $12,988 | $631,000 | $144,830 | $486,170 |
| 2024 | $11,338 | $658,000 | $144,830 | $513,170 |
| 2023 | $12,518 | $616,820 | $139,335 | $534,665 |
| 2022 | $11,778 | $560,745 | $115,864 | $444,881 |
| 2021 | $10,537 | $461,814 | $100,140 | $361,674 |
| 2020 | $10,172 | $437,205 | $100,140 | $337,065 |
| 2019 | $10,349 | $426,136 | $100,140 | $325,996 |
| 2018 | $6,110 | $343,702 | $80,112 | $263,590 |
| 2017 | $1,114 | $62,272 | $62,272 | $0 |
Source: Public Records
Map
Nearby Homes
- 9921 Peninsula Point
- 3604 Kern River Dr
- 9901 Surveyor Rd
- 9820 Surveyor Rd
- 9809 Pikes Peak Place
- 9920 Pikes Peak Place
- 9813 Excursion Dr
- 3609 Sabine Dr
- 9909 Trinity Dr
- 3508 Rio Grande Rd
- 9800 Excursion Dr
- 9813 Rubicon Trail
- 9917 Echo Summit Dr
- 9712 Forester Trail
- 4323 Blackberry Ln
- 10017 Denali Dr
- 10004 Denali Dr
- 9704 Grouse Ridge Ln
- 3721 Wildridge Blvd
- Plan 1580 at Wildridge
- 9912 Peninsula Point
- 9916 Peninsula Point
- 9908 Peninsula Point
- 9913 Peninsula Point
- 9909 Compass Rose Ct
- 9904 Peninsula Point
- 9920 Peninsula Point
- 9905 Compass Rose Ct
- 9909 Peninsula Point
- 9913 Compass Rose Ct
- 9917 Peninsula Point
- 9900 Peninsula Point
- 9917 Compass Rose Ct
- 9901 Compass Rose Ct
- 3700 Kern River Dr
- 3628 Kern River Dr
- 9905 Peninsula Point
- 3624 Kern River Dr
- 3704 Kern River Dr
- 9901 Peninsula Point