Estimated Value: $182,000 - $516,386
5
Beds
2
Baths
3,184
Sq Ft
$110/Sq Ft
Est. Value
About This Home
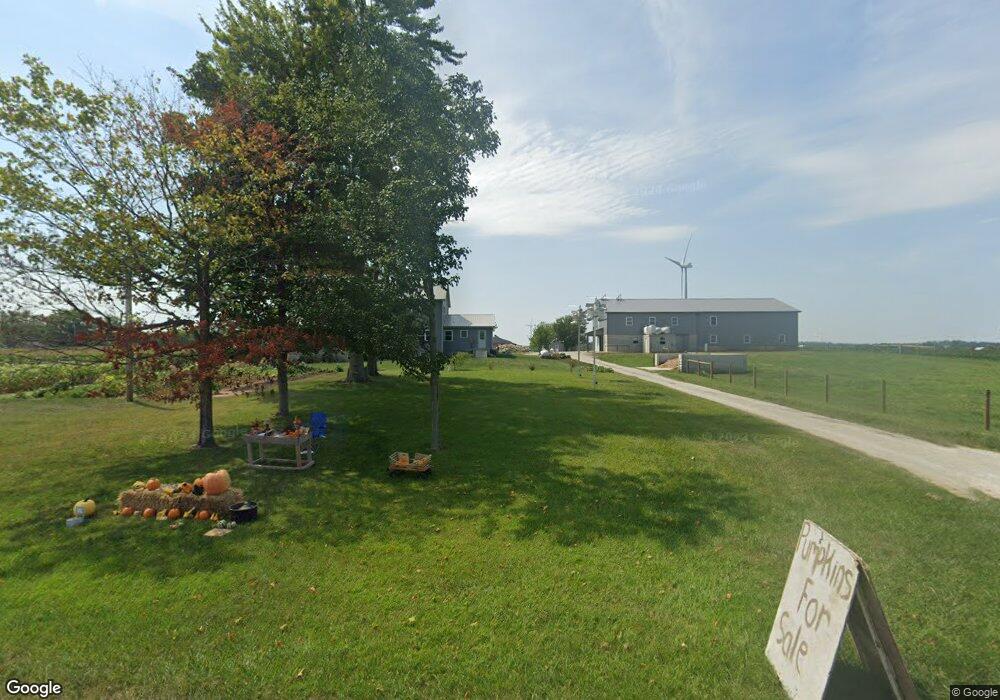
This home is located at 9918 S Bloomingport Rd, Lynn, IN 47355 and is currently estimated at $349,193, approximately $109 per square foot. 9918 S Bloomingport Rd is a home located in Randolph County with nearby schools including Randolph Southern Elementary School, Randolph Southern Junior/Senior High School, and Sunrise School.
Ownership History
Date
Name
Owned For
Owner Type
Purchase Details
Closed on
Sep 5, 2014
Sold by
Landreth Faron
Bought by
Stoltzfoos Henry E and Stoltzfoos Rebecca P
Current Estimated Value
Purchase Details
Closed on
Aug 11, 2010
Sold by
Perfect Circle Credit Union
Bought by
Landreth Faron
Home Financials for this Owner
Home Financials are based on the most recent Mortgage that was taken out on this home.
Original Mortgage
$75,000
Interest Rate
4.6%
Mortgage Type
New Conventional
Purchase Details
Closed on
Dec 16, 2009
Sold by
Biehl Douglas J and Biehl Jennifer A
Bought by
Perfect Circle Credit Union
Create a Home Valuation Report for This Property
The Home Valuation Report is an in-depth analysis detailing your home's value as well as a comparison with similar homes in the area
Home Values in the Area
Average Home Value in this Area
Purchase History
| Date | Buyer | Sale Price | Title Company |
|---|---|---|---|
| Stoltzfoos Henry E | -- | None Available | |
| Landreth Faron | -- | None Available | |
| Perfect Circle Credit Union | $83,000 | None Available |
Source: Public Records
Mortgage History
| Date | Status | Borrower | Loan Amount |
|---|---|---|---|
| Previous Owner | Landreth Faron | $75,000 |
Source: Public Records
Tax History Compared to Growth
Tax History
| Year | Tax Paid | Tax Assessment Tax Assessment Total Assessment is a certain percentage of the fair market value that is determined by local assessors to be the total taxable value of land and additions on the property. | Land | Improvement |
|---|---|---|---|---|
| 2024 | $3,507 | $400,000 | $25,300 | $374,700 |
| 2023 | $2,954 | $355,100 | $23,100 | $332,000 |
| 2022 | $3,436 | $358,200 | $20,800 | $337,400 |
| 2021 | $3,019 | $310,900 | $25,500 | $285,400 |
| 2020 | $2,706 | $280,700 | $23,100 | $257,600 |
| 2019 | $2,106 | $255,500 | $24,800 | $230,700 |
| 2018 | $1,977 | $242,900 | $24,300 | $218,600 |
| 2017 | $1,855 | $243,500 | $25,700 | $217,800 |
| 2016 | $722 | $105,500 | $25,000 | $80,500 |
| 2014 | $712 | $105,100 | $25,500 | $79,600 |
| 2013 | $712 | $101,400 | $23,800 | $77,600 |
Source: Public Records
Map
Nearby Homes
- 501 W Sherman St
- 0 Round Barn Rd
- 410 N Main St
- 1820 E 700 S
- 0 Walnut St
- 8292 Main St
- 274 4th St
- 0 Davis
- 701 W Cherry St
- 2336 W New Garden Rd
- 107 N US Highway 27
- 6855 N Centerville Rd
- 5369 E 700 S
- 9*** County Road 800 W
- 9*** S 800 W
- 219 S Main St
- 6049 U S 35
- 2980 S 225 E
- 3432 S Indian Trail
- 3346 SE Indian Trail Lake Rd
- 1023 W 1000 S
- 1105 W 1000 S
- 1185 W 1000 S
- 10140 S Bloomingport Rd
- 9681 S Bloomingport Rd
- 804 W 1000 S
- 9660 S Bloomingport Rd
- 10147 S Bloomingport Rd
- 1025 W 950 S
- 9626 S Bloomingport Rd
- 9532 S Bloomingport Rd
- 9535 S Bloomingport Rd
- 1394 W 1000 S
- 985 W 950 S
- 9515 S Bloomingport Rd
- 9508 S Bloomingport Rd
- 936 W 950 S
- 1197 W 950 S
- 1060 W 950 S
- 968 W 950 S