Estimated Value: $657,000 - $880,000
3
Beds
2
Baths
2,091
Sq Ft
$360/Sq Ft
Est. Value
About This Home
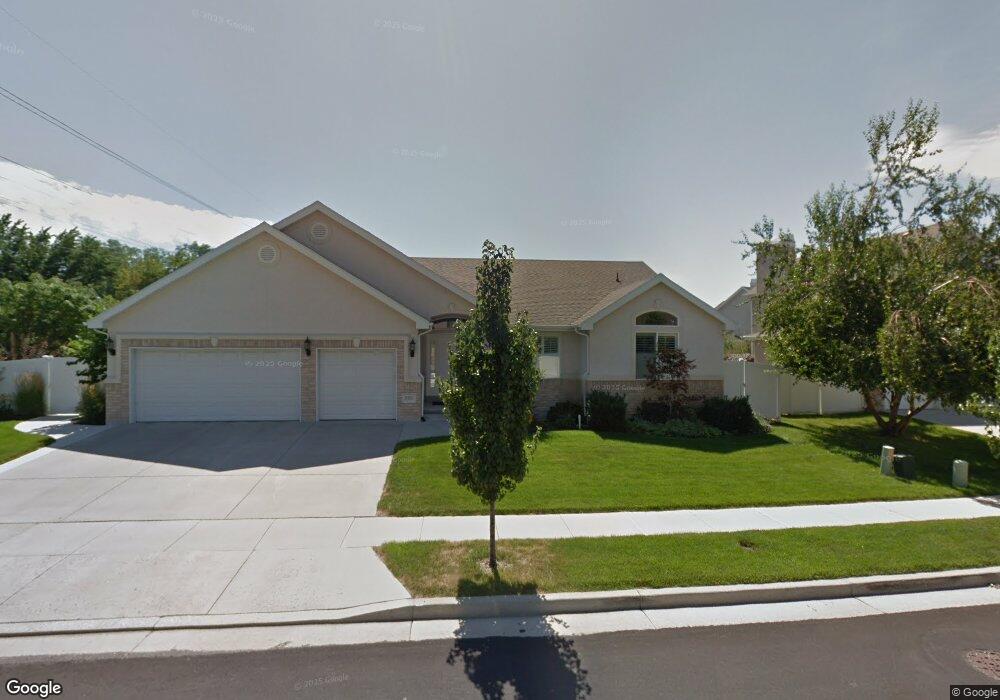
This home is located at 992 Fallbrook Way, Sandy, UT 84094 and is currently estimated at $753,425, approximately $360 per square foot. 992 Fallbrook Way is a home located in Salt Lake County with nearby schools including East Sandy School, Union Middle School, and Hillcrest High School.
Ownership History
Date
Name
Owned For
Owner Type
Purchase Details
Closed on
May 8, 2003
Sold by
Henderson David J and Henderson Annette T
Bought by
Henderson Annette T
Current Estimated Value
Purchase Details
Closed on
Jun 29, 2000
Sold by
New Mark Development Inc
Bought by
Henderson David J and Henderson Annette T
Home Financials for this Owner
Home Financials are based on the most recent Mortgage that was taken out on this home.
Original Mortgage
$183,000
Outstanding Balance
$64,555
Interest Rate
8.03%
Estimated Equity
$688,870
Create a Home Valuation Report for This Property
The Home Valuation Report is an in-depth analysis detailing your home's value as well as a comparison with similar homes in the area
Home Values in the Area
Average Home Value in this Area
Purchase History
| Date | Buyer | Sale Price | Title Company |
|---|---|---|---|
| Henderson Annette T | -- | -- | |
| Henderson David J | -- | First American Title Insuran |
Source: Public Records
Mortgage History
| Date | Status | Borrower | Loan Amount |
|---|---|---|---|
| Open | Henderson David J | $183,000 |
Source: Public Records
Tax History
| Year | Tax Paid | Tax Assessment Tax Assessment Total Assessment is a certain percentage of the fair market value that is determined by local assessors to be the total taxable value of land and additions on the property. | Land | Improvement |
|---|---|---|---|---|
| 2025 | $3,837 | $733,400 | $228,100 | $505,300 |
| 2024 | $3,837 | $708,700 | $219,500 | $489,200 |
| 2023 | $3,444 | $634,400 | $211,000 | $423,400 |
| 2022 | $3,592 | $647,100 | $206,900 | $440,200 |
| 2021 | $4,228 | $500,200 | $180,600 | $319,600 |
| 2020 | $3,202 | $462,400 | $157,200 | $305,200 |
| 2019 | $3,224 | $453,500 | $156,000 | $297,500 |
| 2016 | $2,808 | $369,800 | $140,600 | $229,200 |
Source: Public Records
Map
Nearby Homes
- 1065 E Fallbrook Way
- 8268 S 865 E
- 8373 S 1100 E Unit 39
- 991 Merewood Ct
- 8485 S Harvard Park Dr
- 8136 S Cottonwood Hills Cir
- 8390 S 745 E
- 8583 S Harvard Park Dr
- 760 E 8080 S
- 7899 S 930 E
- 744 E 8425 S
- 8352 S 1330 E
- 798 E Spruce Tree Ln
- 7819 S Spruce Tree Ln
- 8087 S 615 E
- 635 Pioneer Ave
- 954 E 7725 S
- 8322 S Levine Ln Unit 111
- 7755 S 1130 E
- 8722 S Oakwood Park Cir Unit 8722
- 983 Addington Cir
- 982 Fallbrook Way
- 982 E Fallbrook Way
- 991 E Fallbrook Way
- 991 E Fallbrook Way
- 1010 Fallbrook Way
- 977 Addington Cir
- 988 Addington Cir
- 981 E Fallbrook Way
- 8281 S 1000 E
- 981 E Fallbrook Way
- 972 Fallbrook Way
- 8236 S 1000 E
- 8238 S 1000 E
- 1011 Fallbrook Way
- 8241 S Akers Way
- 8241 Akers Way
- 8293 S 1000 E
- 1020 Fallbrook Way
- 982 Addington Cir
Your Personal Tour Guide
Ask me questions while you tour the home.