Estimated Value: $323,000 - $352,000
3
Beds
2
Baths
1,660
Sq Ft
$204/Sq Ft
Est. Value
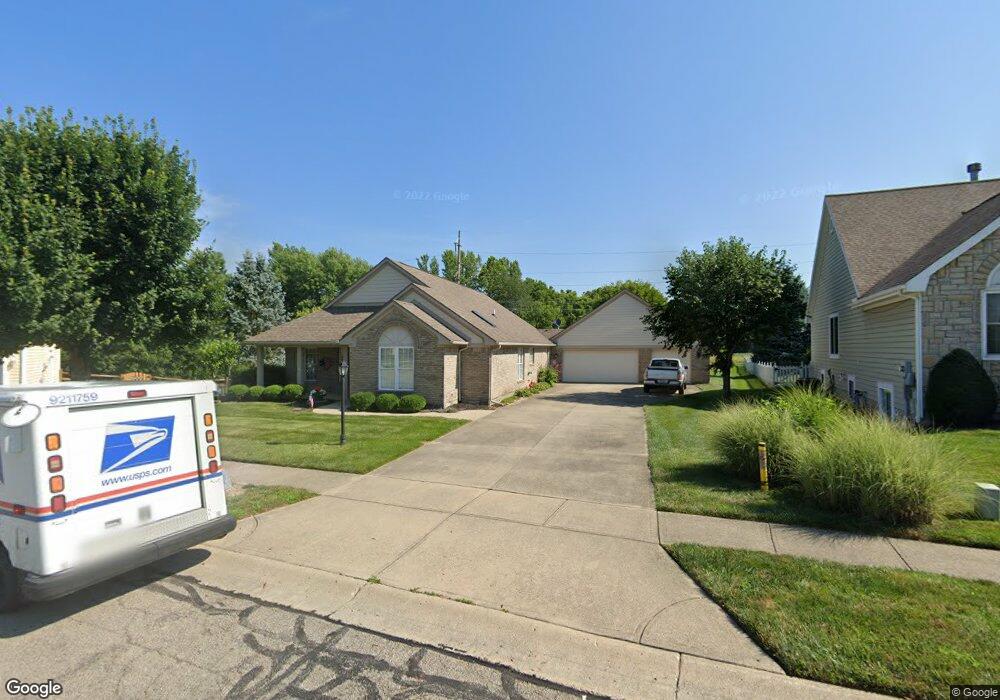
About This Home
This home is located at 992 Orville Way, Xenia, OH 45385 and is currently estimated at $338,488, approximately $203 per square foot. 992 Orville Way is a home located in Greene County with nearby schools including Xenia High School, Summit Academy Community School for Alternative Learners - Xenia, and Legacy Christian Academy.
Ownership History
Date
Name
Owned For
Owner Type
Purchase Details
Closed on
Sep 30, 2020
Sold by
Ringer Jeffrey D and Beverly A Smith Family Preserv
Bought by
Long Philip and Long Retta
Current Estimated Value
Purchase Details
Closed on
Aug 21, 2014
Sold by
Smith Beverly A
Bought by
Ringer Jeffrey D and The Beverly A Smith Family Preservation
Purchase Details
Closed on
May 27, 2011
Sold by
Smith Beverly A and Smith Kenneth F
Bought by
Smith Beverly A and The Beverly A Smith Family Trust
Purchase Details
Closed on
Apr 23, 1998
Sold by
P F D Development P Ll
Bought by
Ringer Ronald L and Ringer Beverly A
Home Financials for this Owner
Home Financials are based on the most recent Mortgage that was taken out on this home.
Original Mortgage
$76,500
Interest Rate
7.2%
Create a Home Valuation Report for This Property
The Home Valuation Report is an in-depth analysis detailing your home's value as well as a comparison with similar homes in the area
Home Values in the Area
Average Home Value in this Area
Purchase History
| Date | Buyer | Sale Price | Title Company |
|---|---|---|---|
| Long Philip | $200,000 | None Available | |
| Ringer Jeffrey D | -- | None Available | |
| Smith Beverly A | -- | None Available | |
| Smith Beverly A | -- | Attorney | |
| Ringer Ronald L | $31,900 | -- |
Source: Public Records
Mortgage History
| Date | Status | Borrower | Loan Amount |
|---|---|---|---|
| Previous Owner | Ringer Ronald L | $76,500 |
Source: Public Records
Tax History Compared to Growth
Tax History
| Year | Tax Paid | Tax Assessment Tax Assessment Total Assessment is a certain percentage of the fair market value that is determined by local assessors to be the total taxable value of land and additions on the property. | Land | Improvement |
|---|---|---|---|---|
| 2024 | $3,909 | $93,600 | $26,760 | $66,840 |
| 2023 | $3,909 | $93,600 | $26,760 | $66,840 |
| 2022 | $3,467 | $70,750 | $17,840 | $52,910 |
| 2021 | $3,514 | $70,750 | $17,840 | $52,910 |
| 2020 | $2,948 | $70,750 | $17,840 | $52,910 |
| 2019 | $2,912 | $66,410 | $21,710 | $44,700 |
| 2018 | $2,917 | $66,410 | $21,710 | $44,700 |
| 2017 | $2,804 | $66,410 | $21,710 | $44,700 |
| 2016 | $2,804 | $63,030 | $21,710 | $41,320 |
| 2015 | $906 | $63,030 | $21,710 | $41,320 |
| 2014 | $2,690 | $63,030 | $21,710 | $41,320 |
Source: Public Records
Map
Nearby Homes
- 2223 Tandem Dr
- 2144 Tandem Dr
- 2096 High Wheel Dr
- 2540 Cornwall Dr
- 1881 Commonwealth Dr
- 2499 Jenny Marie Dr
- 2540 Jenny Marie Dr
- 1255 Colorado Dr
- 2421 Louisiana Dr
- 0 Berkshire Dr Unit 942854
- 2187 Minnesota Dr
- 1908 Whitt St
- 2265 Minnesota Dr
- 2189 Mississippi Dr
- 1766 Gayhart Dr
- 2852 Raxit Ct
- 2685 Childers Dr
- 1272 Bellbrook Ave
- 2064 Maryland Dr
- 1208 Bellbrook Ave
- 984 Orville Way
- 1870 Kitty Hawk Dr
- 976 Orville Way
- 1880 Kitty Hawk Dr
- 989 Orville Way
- 968 Orville Way
- 977 Orville Way
- 1890 Kitty Hawk Dr
- 969 Orville Way
- 960 Orville Way
- 1891 Kitty Hawk Dr
- 996 Wright Ave
- 1900 Kitty Hawk Dr
- 961 Orville Way
- 988 Wright Ave
- 952 Orville Way
- 953 Orville Way
- 1910 Kitty Hawk Dr
- 1911 Kitty Hawk Dr
- 980 Wright Ave