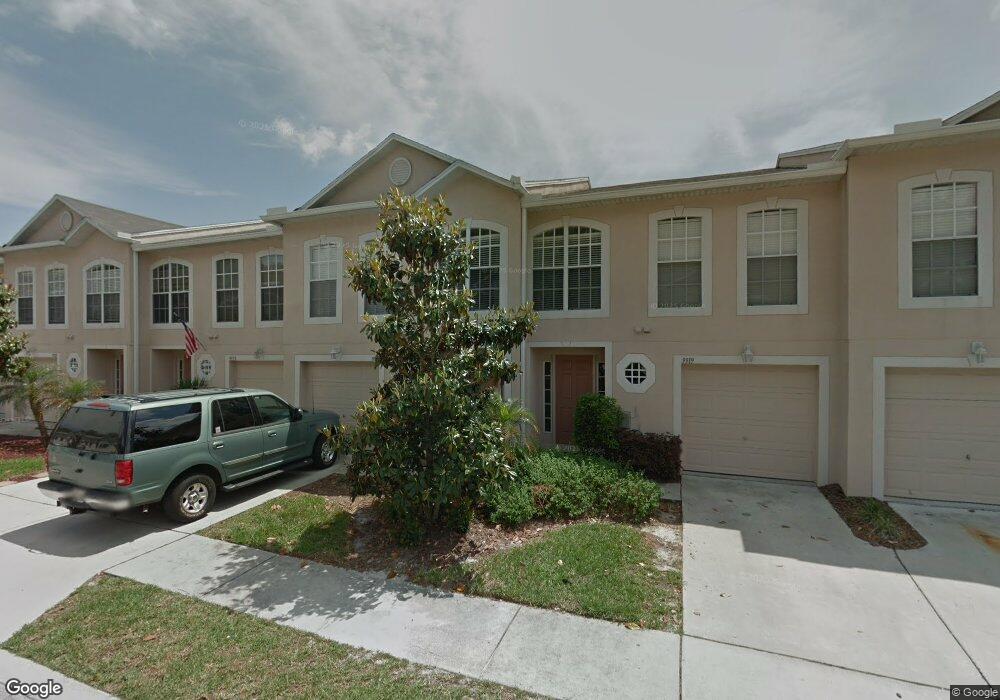
9921 Ashburn Lake Dr Tampa, FL 33610
East Lake-Orient Park NeighborhoodEstimated Value: $241,000 - $259,000
3
Beds
3
Baths
1,948
Sq Ft
$128/Sq Ft
Est. Value
About This Home
This home is located at 9921 Ashburn Lake Dr, Tampa, FL 33610 and is currently estimated at $249,873, approximately $128 per square foot. 9921 Ashburn Lake Dr is a home located in Hillsborough County with nearby schools including Mcdonald Elementary School, Jennings Middle School, and Armwood High School.
Ownership History
Date
Name
Owned For
Owner Type
Purchase Details
Closed on
Jan 11, 2013
Sold by
Rivera Carlos R
Bought by
Tran Tom
Current Estimated Value
Purchase Details
Closed on
Aug 11, 2011
Sold by
Zeev Bar El Llc
Bought by
Rivera Carlos R and Rivera Janet
Purchase Details
Closed on
Dec 31, 2010
Sold by
Rivera Carlos R and Rivera Janet
Bought by
Ze Ev Bar El Llc
Purchase Details
Closed on
Jan 31, 2008
Sold by
Zb Equities Llc
Bought by
Rivera Carlos R and Rivera Janet
Purchase Details
Closed on
Jan 30, 2008
Sold by
Rivera Carlos R and Rivera Janet
Bought by
Zb Equities Llc
Purchase Details
Closed on
Jul 28, 2006
Sold by
Maronda Homes Inc Of Florida
Bought by
Rivera Carlos R and Rivera Janet
Home Financials for this Owner
Home Financials are based on the most recent Mortgage that was taken out on this home.
Original Mortgage
$143,704
Interest Rate
6.75%
Mortgage Type
Unknown
Create a Home Valuation Report for This Property
The Home Valuation Report is an in-depth analysis detailing your home's value as well as a comparison with similar homes in the area
Home Values in the Area
Average Home Value in this Area
Purchase History
| Date | Buyer | Sale Price | Title Company |
|---|---|---|---|
| Tran Tom | $55,000 | None Available | |
| Rivera Carlos R | -- | None Available | |
| Ze Ev Bar El Llc | -- | None Available | |
| Rivera Carlos R | -- | None Available | |
| Zb Equities Llc | -- | Pan American Title Co | |
| Rivera Carlos R | $179,700 | Southern Title |
Source: Public Records
Mortgage History
| Date | Status | Borrower | Loan Amount |
|---|---|---|---|
| Previous Owner | Rivera Carlos R | $143,704 |
Source: Public Records
Tax History Compared to Growth
Tax History
| Year | Tax Paid | Tax Assessment Tax Assessment Total Assessment is a certain percentage of the fair market value that is determined by local assessors to be the total taxable value of land and additions on the property. | Land | Improvement |
|---|---|---|---|---|
| 2024 | $3,705 | $221,297 | $22,130 | $199,167 |
| 2023 | $3,402 | $204,757 | $20,476 | $184,281 |
| 2022 | $3,046 | $182,061 | $18,206 | $163,855 |
| 2021 | $2,636 | $126,121 | $12,612 | $113,509 |
| 2020 | $2,513 | $121,839 | $12,184 | $109,655 |
| 2019 | $2,418 | $123,702 | $12,370 | $111,332 |
| 2018 | $2,235 | $110,581 | $0 | $0 |
| 2017 | $2,095 | $103,827 | $0 | $0 |
| 2016 | $1,950 | $86,982 | $0 | $0 |
| 2015 | $1,780 | $79,075 | $0 | $0 |
| 2014 | $1,637 | $71,886 | $0 | $0 |
| 2013 | -- | $75,420 | $0 | $0 |
Source: Public Records
Map
Nearby Homes
- 4656 Ashburn Square Dr
- 4810 Valda Ln Unit 329
- 9710 Polak Dr Unit 237
- 9707 Polak Dr Unit 218
- 9708 Linda Place Unit 297
- 9810 Fan Palm Way
- 4801 Allen Way Unit 278
- 4807 Allen Way Unit 281
- 9508 Ashburn Creek Ln
- 10125 Ellen Ave
- 10124 Ellen Ave
- 9444 Sunset Dr Unit 106
- 10201 Hawk Storm Ave
- 9437 Polak Dr Unit 209
- 4140 Bismarck Palm Dr
- 9407 Tiffany Terrace Unit 350
- 9457 Sunset Dr Unit 89
- 4823 Allen Way Unit 287
- 9435 Sunset Dr Unit 84
- 10212 Hawk Storm Ave
- 9921 Ashburn Lake Dr
- 9919 Ashburn Lake Dr
- 9927 Ashburn Lake Dr
- 9925 Ashburn Lake Dr
- 9925 Ashburn Lake Dr Unit 9925
- 9940 Ashburn Lake Dr
- 9943 Ashburn Lake Dr
- 9913 Ashburn Lake Dr
- 9926 Ashburn Lake Dr
- 9931 Ashburn Lake Dr
- 9920 Ashburn Lake Dr
- 9922 Ashburn Lake Dr
- 9922 Ashburn Lake Dr Unit 9922
- 9933 Ashburn Lake Dr
- 9909 Ashburn Lake Dr
- 9916 Ashburn Lake Dr
- 9914 Ashburn Lake Dr
- 9935 Ashburn Lake Dr
- 9918 Ashburn Lake Dr