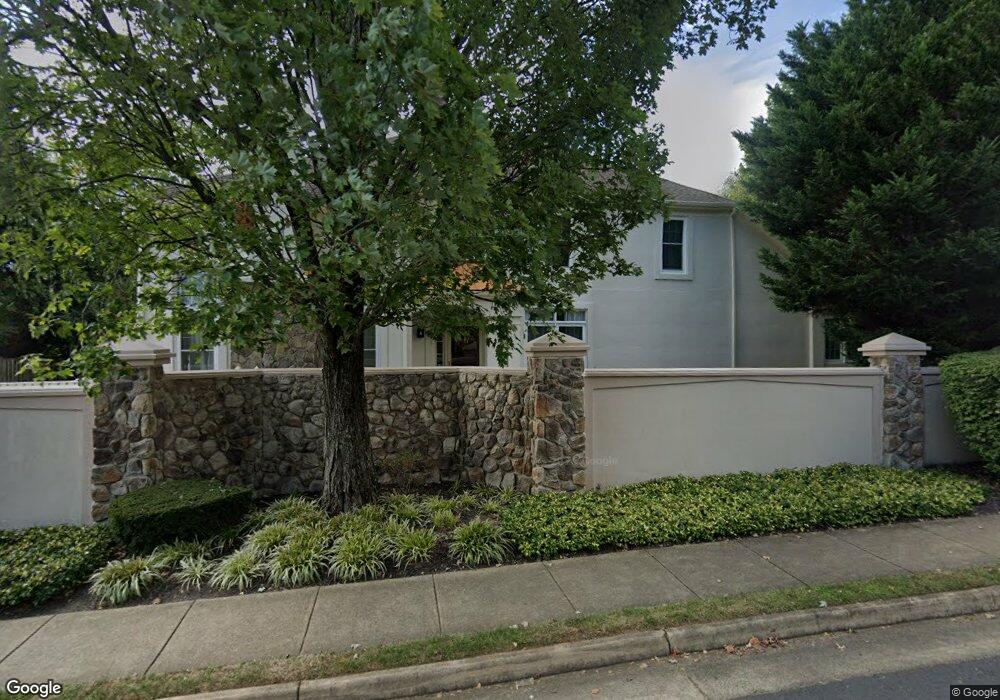
9921 Bickley Ct Vienna, VA 22181
Estimated Value: $1,318,000 - $1,369,000
4
Beds
5
Baths
3,346
Sq Ft
$401/Sq Ft
Est. Value
About This Home
This home is located at 9921 Bickley Ct, Vienna, VA 22181 and is currently estimated at $1,343,035, approximately $401 per square foot. 9921 Bickley Ct is a home located in Fairfax County with nearby schools including Mosby Woods Elementary School, Thoreau Middle School, and Appletree School.
Ownership History
Date
Name
Owned For
Owner Type
Purchase Details
Closed on
Mar 17, 2023
Sold by
Lee Robert M and Jung Im
Bought by
Nesrane Yared Tekletsion
Current Estimated Value
Home Financials for this Owner
Home Financials are based on the most recent Mortgage that was taken out on this home.
Original Mortgage
$840,000
Outstanding Balance
$809,876
Interest Rate
5.38%
Mortgage Type
New Conventional
Estimated Equity
$533,159
Purchase Details
Closed on
Jun 25, 1999
Sold by
Edgemoore Ltd Ptnrshp
Bought by
Lee Robert M
Home Financials for this Owner
Home Financials are based on the most recent Mortgage that was taken out on this home.
Original Mortgage
$147,000
Interest Rate
7.09%
Create a Home Valuation Report for This Property
The Home Valuation Report is an in-depth analysis detailing your home's value as well as a comparison with similar homes in the area
Home Values in the Area
Average Home Value in this Area
Purchase History
| Date | Buyer | Sale Price | Title Company |
|---|---|---|---|
| Nesrane Yared Tekletsion | $1,050,000 | Old Republic Title | |
| Nesrane Yared Tekletsion | $1,050,000 | Old Republic Title | |
| Lee Robert M | $397,000 | -- |
Source: Public Records
Mortgage History
| Date | Status | Borrower | Loan Amount |
|---|---|---|---|
| Open | Nesrane Yared Tekletsion | $840,000 | |
| Closed | Nesrane Yared Tekletsion | $840,000 | |
| Previous Owner | Lee Robert M | $147,000 |
Source: Public Records
Tax History Compared to Growth
Tax History
| Year | Tax Paid | Tax Assessment Tax Assessment Total Assessment is a certain percentage of the fair market value that is determined by local assessors to be the total taxable value of land and additions on the property. | Land | Improvement |
|---|---|---|---|---|
| 2025 | $12,600 | $1,217,240 | $438,000 | $779,240 |
| 2024 | $12,600 | $1,087,590 | $398,000 | $689,590 |
| 2023 | $12,273 | $1,087,590 | $398,000 | $689,590 |
| 2022 | $11,533 | $1,008,560 | $358,000 | $650,560 |
| 2021 | $10,501 | $894,840 | $298,000 | $596,840 |
| 2020 | $10,319 | $871,880 | $298,000 | $573,880 |
| 2019 | $9,995 | $844,550 | $298,000 | $546,550 |
| 2018 | $9,712 | $844,550 | $298,000 | $546,550 |
| 2017 | $9,740 | $838,930 | $298,000 | $540,930 |
| 2016 | $9,309 | $803,540 | $298,000 | $505,540 |
| 2015 | $8,968 | $803,540 | $298,000 | $505,540 |
| 2014 | $8,726 | $783,630 | $288,000 | $495,630 |
Source: Public Records
Map
Nearby Homes
- 9908 Blake Ln
- 9914 Brightlea Dr
- 2960 Hibbard St
- 3010 Steven Martin Dr
- 9720 Five Oaks Rd
- 9744 Water Oak Dr
- 9927 Miles Stone Ct
- 3154 Valentino Ct
- 3154 Stratford Ct
- 10172 Turnberry Place
- 10195A Ashbrooke Ct Unit 109
- 9650 Masterworks Dr
- 3113 Buccaneer Ct Unit 2
- 10208 Bushman Dr
- 10208 Bushman Dr Unit 422
- 9715 Kings Crown Ct Unit 202
- 9800 Kingsbridge Dr Unit 2
- 2754 Chain Bridge Rd
- 2903 Saintsbury Plaza Unit 310
- 2903 Saintsbury Plaza Unit 405
- 9923 Bickley Ct
- 9925 Bickley Ct
- 2944 Edgelea Rd
- 9927 Trosby Ct
- 9927 Bickley Ct
- 2909 Langholm Place
- 9925 Trosby Ct
- 9923 Trosby Ct
- 2907 Langholm Place
- 9929 Bickley Ct
- 9921 Trosby Ct
- 9914 Trosby Ct
- 2908 Langholm Place
- 9908 Michael Schar Ct
- 2946 Edgelea Rd
- 9912 Trosby Ct
- 9906 Michael Schar Ct
- 2905 Langholm Place
- 9904 Blake Ln
- 9931 Bickley Ct