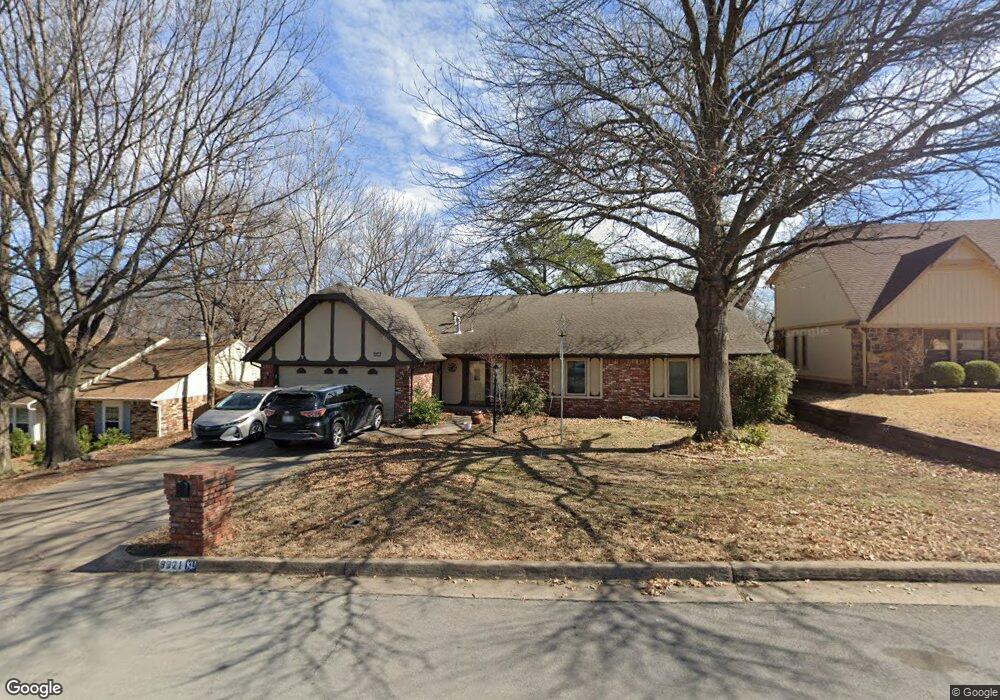
9921 S 72nd East Ave Tulsa, OK 74133
Knollwood Estates NeighborhoodEstimated Value: $279,381 - $292,000
--
Bed
2
Baths
1,954
Sq Ft
$145/Sq Ft
Est. Value
About This Home
This home is located at 9921 S 72nd East Ave, Tulsa, OK 74133 and is currently estimated at $283,345, approximately $145 per square foot. 9921 S 72nd East Ave is a home located in Tulsa County with nearby schools including Jenks East Elementary School, Jenks Middle School, and Jenks East Intermediate Elementary School.
Ownership History
Date
Name
Owned For
Owner Type
Purchase Details
Closed on
Jun 2, 2009
Sold by
Meeker Wayne E and Meeker Wayne Eugene
Bought by
Peek Edwin L and Peek Shari D
Current Estimated Value
Home Financials for this Owner
Home Financials are based on the most recent Mortgage that was taken out on this home.
Original Mortgage
$144,620
Outstanding Balance
$91,668
Interest Rate
4.83%
Mortgage Type
VA
Estimated Equity
$191,677
Purchase Details
Closed on
Nov 21, 2005
Sold by
Sirva Relocation Llc
Bought by
Meeker Wayne E
Home Financials for this Owner
Home Financials are based on the most recent Mortgage that was taken out on this home.
Original Mortgage
$90,000
Interest Rate
6.29%
Mortgage Type
Fannie Mae Freddie Mac
Purchase Details
Closed on
Jul 30, 2005
Sold by
Hacker Lincoln B and Hacker Shanna M
Bought by
Sirva Relocation Llc
Purchase Details
Closed on
Mar 15, 2001
Sold by
Mcknight Jerald Lyn and Mcknight Angna G
Bought by
Hacker Lincoln B
Purchase Details
Closed on
Nov 1, 1992
Create a Home Valuation Report for This Property
The Home Valuation Report is an in-depth analysis detailing your home's value as well as a comparison with similar homes in the area
Home Values in the Area
Average Home Value in this Area
Purchase History
| Date | Buyer | Sale Price | Title Company |
|---|---|---|---|
| Peek Edwin L | $140,000 | First American Title | |
| Meeker Wayne E | $125,000 | First American Title & Abstr | |
| Sirva Relocation Llc | $131,500 | First American Title & Abstr | |
| Hacker Lincoln B | $129,500 | First Amer Title & Trust Co | |
| -- | $107,000 | -- |
Source: Public Records
Mortgage History
| Date | Status | Borrower | Loan Amount |
|---|---|---|---|
| Open | Peek Edwin L | $144,620 | |
| Previous Owner | Meeker Wayne E | $90,000 |
Source: Public Records
Tax History Compared to Growth
Tax History
| Year | Tax Paid | Tax Assessment Tax Assessment Total Assessment is a certain percentage of the fair market value that is determined by local assessors to be the total taxable value of land and additions on the property. | Land | Improvement |
|---|---|---|---|---|
| 2024 | $2,542 | $19,697 | $2,939 | $16,758 |
| 2023 | $2,542 | $20,094 | $3,077 | $17,017 |
| 2022 | $2,541 | $18,508 | $3,613 | $14,895 |
| 2021 | $2,497 | $17,940 | $3,502 | $14,438 |
| 2020 | $2,369 | $17,388 | $3,394 | $13,994 |
| 2019 | $2,374 | $16,853 | $3,290 | $13,563 |
| 2018 | $2,300 | $16,333 | $3,188 | $13,145 |
| 2017 | $2,176 | $16,828 | $3,285 | $13,543 |
| 2016 | $2,117 | $16,338 | $3,301 | $13,037 |
| 2015 | $2,090 | $18,564 | $3,751 | $14,813 |
| 2014 | $2,019 | $15,400 | $3,751 | $11,649 |
Source: Public Records
Map
Nearby Homes
- 9924 S 69th East Ave
- 7708 E 99th St
- 10122 S 72nd East Ave
- 9926 S 79th East Ave
- 10224 S 68th East Ave
- 9912 S 67th East Ave
- 6723 E 97th St
- 10135 S 78th East Ave
- 9910 S 66th East Ave
- 7506 E 94th St
- 9421 S 69th East Ave
- 9361 S 67th East Ave
- 10028 S Norwood Ave
- 6226 E 98th St
- 9208 S 70th Ave E
- 10006 S Maplewood Ave
- 8414 E 99th Place
- 6133 E 97th St
- 8420 E 100th St
- 6530 E 106th St
- 9915 S 72nd East Ave
- 9927 S 72nd East Ave
- 9933 S 72nd East Ave
- 9909 S 72nd East Ave
- 9922 S 72nd Ave E
- 9916 S 72nd East Ave
- 9928 S 72nd East Ave
- 9939 S 72nd East Ave
- 9934 S 72nd Ave E
- 9903 S 72nd East Ave
- 9828 S 74th East Ave
- 9828 S 74th East Ave
- 9910 S 72nd East Ave
- 9904 S 72nd Ave E
- 9940 S 72nd East Ave
- 9945 S 72nd East Ave
- 9904 S 72nd East Ave
- 9921 S 71st East Ave
- 9839 S 72nd East Ave
- 9915 S 71st East Ave