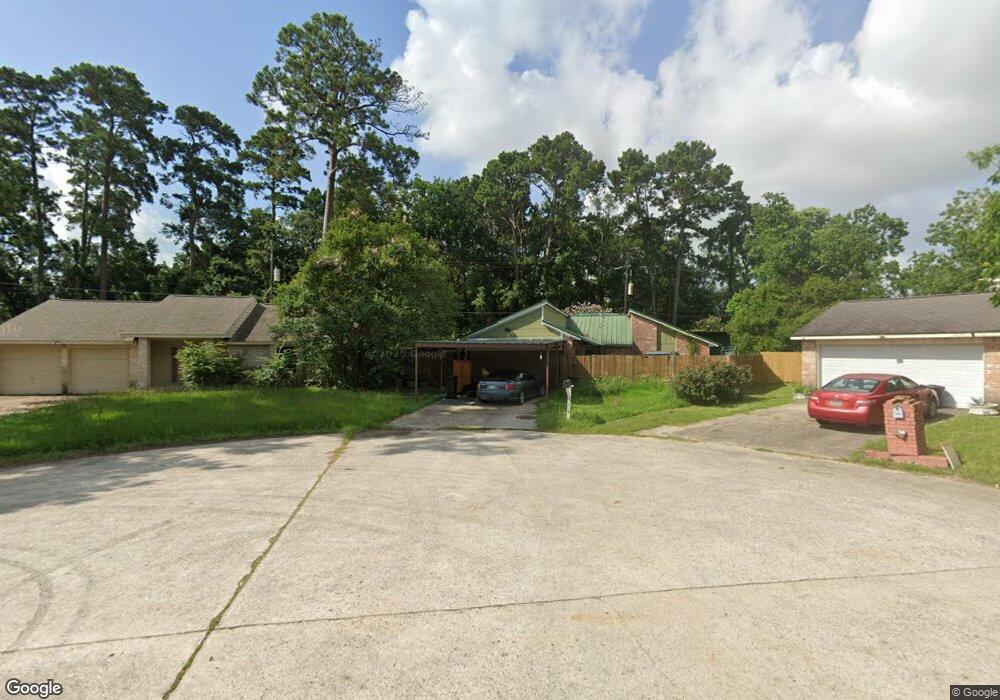
9924 Gannet Ct Conroe, TX 77385
Estimated Value: $200,402 - $307,000
--
Bed
1
Bath
1,719
Sq Ft
$147/Sq Ft
Est. Value
About This Home
This home is located at 9924 Gannet Ct, Conroe, TX 77385 and is currently estimated at $251,851, approximately $146 per square foot. 9924 Gannet Ct is a home located in Montgomery County with nearby schools including Suchma Elementary School, Irons J High School, and Oak Ridge High School.
Ownership History
Date
Name
Owned For
Owner Type
Purchase Details
Closed on
May 14, 2005
Sold by
Carlson Larry P
Bought by
Christensen Lynette M
Current Estimated Value
Home Financials for this Owner
Home Financials are based on the most recent Mortgage that was taken out on this home.
Original Mortgage
$40,000
Outstanding Balance
$20,762
Interest Rate
5.87%
Mortgage Type
Seller Take Back
Estimated Equity
$231,089
Purchase Details
Closed on
Jan 18, 2001
Sold by
Urgena Ariel L and Urgena Tina C
Bought by
Christensen Lynette M
Home Financials for this Owner
Home Financials are based on the most recent Mortgage that was taken out on this home.
Original Mortgage
$50,400
Interest Rate
10.25%
Purchase Details
Closed on
Sep 30, 1991
Sold by
Robbins Robbins G and Robbins Vera M
Bought by
Christensen Lynette M
Purchase Details
Closed on
Oct 1, 1988
Bought by
Christensen Lynette M
Create a Home Valuation Report for This Property
The Home Valuation Report is an in-depth analysis detailing your home's value as well as a comparison with similar homes in the area
Home Values in the Area
Average Home Value in this Area
Purchase History
| Date | Buyer | Sale Price | Title Company |
|---|---|---|---|
| Christensen Lynette M | -- | -- | |
| Christensen Lynette M | -- | First Surety Title Company | |
| Christensen Lynette M | -- | -- | |
| Christensen Lynette M | -- | -- |
Source: Public Records
Mortgage History
| Date | Status | Borrower | Loan Amount |
|---|---|---|---|
| Open | Christensen Lynette M | $40,000 | |
| Previous Owner | Christensen Lynette M | $50,400 |
Source: Public Records
Tax History Compared to Growth
Tax History
| Year | Tax Paid | Tax Assessment Tax Assessment Total Assessment is a certain percentage of the fair market value that is determined by local assessors to be the total taxable value of land and additions on the property. | Land | Improvement |
|---|---|---|---|---|
| 2025 | $2,920 | $175,505 | $21,183 | $154,322 |
| 2024 | $2,920 | $131,466 | $21,183 | $110,283 |
| 2023 | $845 | $143,980 | $21,180 | $135,180 |
| 2022 | $2,685 | $130,890 | $21,180 | $123,690 |
| 2021 | $3,104 | $118,990 | $21,180 | $103,320 |
| 2020 | $2,983 | $108,170 | $21,180 | $88,030 |
| 2019 | $2,837 | $98,340 | $8,020 | $100,750 |
| 2018 | $1,310 | $89,400 | $8,020 | $83,220 |
| 2017 | $2,388 | $81,270 | $8,020 | $93,740 |
| 2016 | $2,171 | $73,880 | $8,020 | $80,410 |
| 2015 | $866 | $67,160 | $8,020 | $74,500 |
| 2014 | $866 | $61,050 | $8,020 | $53,030 |
Source: Public Records
Map
Nearby Homes
- 16817 Pink Wintergreen Dr
- 17105 Upland Bent Ct
- 9955 Preserve Way
- 10255 S Goshawk Trail
- 10029 Red Beadtree Place
- 17015 Ash Leaf Way
- 9291 Inland Leather Ln
- 10202 S Goshawk Trail
- 17027 Shy Leaf Ct
- 9253 Inland Leather Ln
- 17068 Easter Lily Dr
- 17108 Coneflower Place
- 10660 Red Tail Place
- 10325 S Goshawk Trail
- 10329 S Goshawk Trail
- 9863 Swan Ct
- 9715 Migrant Hawker Ct
- 17129 Sprawling Oaks Dr
- 9727 Migrant Hawker Ct
- 10066 Preserve Way
- 9920 Gannet Ct
- 9928 Gannet Ct
- 9932 Gannet Ct
- 9921 Gannet Ct
- 9925 Gannet Ct
- 9929 Gannet Ct
- 9936 Gannet Ct
- 9933 Gannet Ct
- 9904 Burrowing Owl
- 9930 Glen Jay Ct
- Lot 29 Glenoaks Dr
- Lot 28 Glenoaks Dr
- Lot 43 Glenoaks Dr
- Lot 44 Glenoaks Dr
- Lot 45 Glenoaks Dr
- 9934 Glen Jay Ct
- 9926 Glen Jay Ct
- 9938 Glen Jay Ct
- 17247 Glen Oaks Dr
- 17243 Glen Oaks Dr