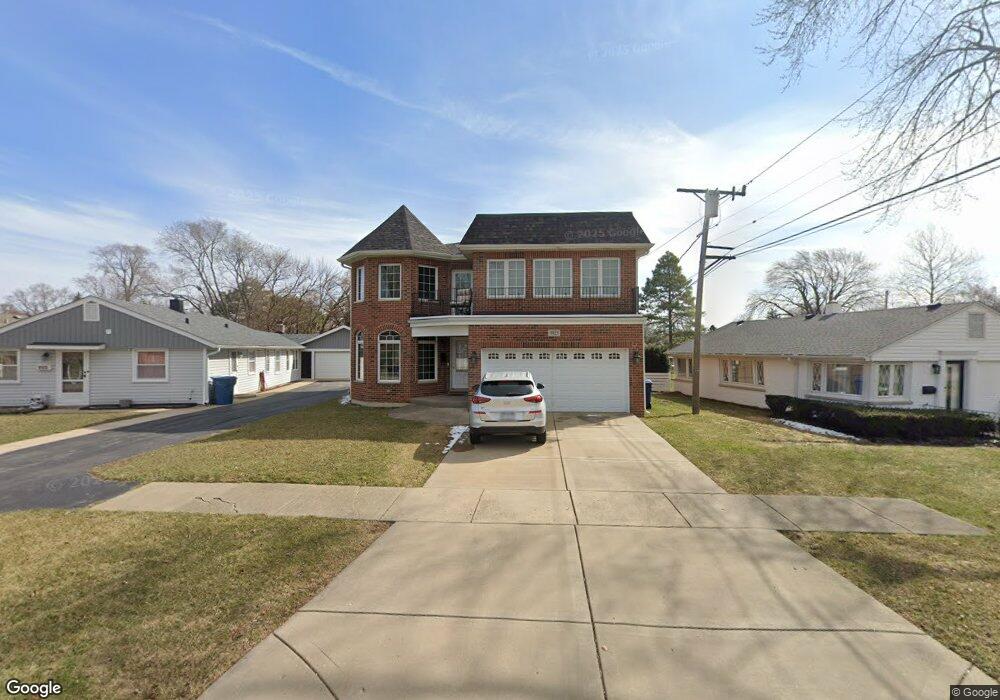
9927 S 52nd Ave Unit 1 Oak Lawn, IL 60453
Estimated Value: $445,000 - $585,000
3
Beds
3
Baths
2,350
Sq Ft
$209/Sq Ft
Est. Value
About This Home
This home is located at 9927 S 52nd Ave Unit 1, Oak Lawn, IL 60453 and is currently estimated at $491,697, approximately $209 per square foot. 9927 S 52nd Ave Unit 1 is a home located in Cook County with nearby schools including Sward Elementary School, J Covington Elementary School, and Kolmar Avenue Elementary School.
Ownership History
Date
Name
Owned For
Owner Type
Purchase Details
Closed on
Dec 14, 2012
Sold by
King Jerry P and Cox Virginia
Bought by
King Jerry P and King Virginia A
Current Estimated Value
Home Financials for this Owner
Home Financials are based on the most recent Mortgage that was taken out on this home.
Original Mortgage
$317,184
Outstanding Balance
$224,861
Interest Rate
3.87%
Mortgage Type
New Conventional
Estimated Equity
$266,836
Purchase Details
Closed on
Oct 7, 2005
Sold by
King Jerry P
Bought by
King Jerry P and Cox Virginia
Home Financials for this Owner
Home Financials are based on the most recent Mortgage that was taken out on this home.
Original Mortgage
$336,000
Interest Rate
5.82%
Mortgage Type
Construction
Purchase Details
Closed on
Jun 1, 1995
Sold by
Roll Mary Rose and Lyons Mary Rose
Bought by
King Jerry P
Home Financials for this Owner
Home Financials are based on the most recent Mortgage that was taken out on this home.
Original Mortgage
$108,050
Interest Rate
8.27%
Create a Home Valuation Report for This Property
The Home Valuation Report is an in-depth analysis detailing your home's value as well as a comparison with similar homes in the area
Home Values in the Area
Average Home Value in this Area
Purchase History
| Date | Buyer | Sale Price | Title Company |
|---|---|---|---|
| King Jerry P | -- | Old Republic National Title | |
| King Jerry P | -- | Stewart Title Guaranty Compa | |
| King Jerry P | $114,000 | Enterprise Land Title Ltd |
Source: Public Records
Mortgage History
| Date | Status | Borrower | Loan Amount |
|---|---|---|---|
| Open | King Jerry P | $317,184 | |
| Closed | King Jerry P | $336,000 | |
| Closed | King Jerry P | $108,050 |
Source: Public Records
Tax History Compared to Growth
Tax History
| Year | Tax Paid | Tax Assessment Tax Assessment Total Assessment is a certain percentage of the fair market value that is determined by local assessors to be the total taxable value of land and additions on the property. | Land | Improvement |
|---|---|---|---|---|
| 2024 | $11,059 | $37,736 | $4,500 | $33,236 |
| 2023 | $12,635 | $37,736 | $4,500 | $33,236 |
| 2022 | $12,635 | $35,472 | $3,938 | $31,534 |
| 2021 | $12,331 | $35,470 | $3,937 | $31,533 |
| 2020 | $12,296 | $35,470 | $3,937 | $31,533 |
| 2019 | $11,318 | $32,949 | $3,562 | $29,387 |
| 2018 | $10,893 | $32,949 | $3,562 | $29,387 |
| 2017 | $11,052 | $32,949 | $3,562 | $29,387 |
| 2016 | $10,178 | $28,518 | $3,000 | $25,518 |
| 2015 | $9,980 | $28,518 | $3,000 | $25,518 |
| 2014 | $9,858 | $28,518 | $3,000 | $25,518 |
| 2013 | $9,732 | $32,887 | $3,000 | $29,887 |
Source: Public Records
Map
Nearby Homes
- 10012 S 52nd Ave
- 10010 Harnew Rd W Unit 1
- 10021 Cook Ave
- 10016 Harnew Rd W
- 5168 W 99th St
- 5120 W 101st St
- 5125 W 101st St
- 9953 Elm Circle Dr
- 9711 Tulley Ave
- 10100 Alice Ct
- 9706 S 52nd Ave
- 9909 Elm Circle Dr
- 5300 Oakdale Dr
- 9828 Warren Ave
- 5509 Oak Center Dr
- 9904 S Cicero Ave
- 9735 S 55th Ave
- 9807 Washington Ave
- 5424 Franklin Ave
- 5100 W 96th St Unit 442
- 9923 S 52nd Ave
- 5141 Oak Center Dr
- 9935 S 52nd Ave
- 5137 Oak Center Dr Unit 1
- 5126 W 100th St Unit 1
- 9939 S 52nd Ave
- 5133 Oak Center Dr
- 5122 W 100th St
- 9932 S 52nd Ave
- 5129 Oak Center Dr
- 9928 S 52nd Ave
- 9936 S 52nd Ave
- 9924 S 52nd Ave
- 5118 W 100th St
- 9940 S 52nd Ave
- 5125 Oak Center Dr
- 5128 Oak Center Dr
- 5132 Oak Center Dr Unit 1
- 9944 S 52nd Ave
- 5124 Oak Center Dr Unit 1